10-K: Annual report [Section 13 and 15(d), not S-K Item 405]
Published on November 26, 2025
UNITED STATES
SECURITIES AND EXCHANGE COMMISSION
Washington, D.C. 20549
FORM 10-K
| ANNUAL REPORT PURSUANT TO SECTION 13 or 15(d) OF THE SECURITIES EXCHANGE ACT OF 1934 | |||||
For the fiscal year ended September 27 , 2025
OR
| TRANSITION REPORT PURSUANT TO SECTION 13 or 15(d) OF THE SECURITIES EXCHANGE ACT OF 1934 | |||||
For the transition period from ________ to ________
Commission File Number 1-33268

Central Garden & Pet Company
(Exact name of registrant as specified in its charter)
| (State or other jurisdiction of incorporation or organization) | (IRS Employer Identification Number) | ||||
(Address of principal executive offices) (Zip Code)
Telephone Number: (925 ) 948-4000
SECURITIES REGISTERED PURSUANT TO SECTION 12(b) OF THE ACT:
| Title of Each Class | Trading Symbol(s) | Name of Each Exchange on Which Registered | ||||||
SECURITIES REGISTERED PURSUANT TO SECTION 12(g) OF THE ACT: None
Indicate by check mark if the registrant is a well-known seasoned issuer, as defined in Rule 405 of the Securities Act. Yes ☒ No ☐
Indicate by check mark if the registrant is not required to file reports pursuant to Section 13 or Section 15(d) of the Act. Yes ☐ No ☒
Indicate by check mark whether the registrant (1) has filed all reports required to be filed by Section 13 or 15(d) of the Securities Exchange Act of 1934 during the preceding 12 months (or for such shorter period that the registrant was required to file such reports), and (2) has been subject to such filing requirements for the past 90 days. Yes ☒ No ☐
Indicate by check mark whether the registrant has submitted electronically every Interactive Data File required to be submitted pursuant to Rule 405 of Regulation S-T (§ 232.405 of this chapter) during the preceding 12 months (or for such shorter period that the registrant was required to submit and post such files). Yes ☒ No ☐
Indicate by check mark whether the registrant is a large accelerated filer, an accelerated filer, a non-accelerated filer, smaller reporting company, or an emerging growth company. See the definitions of “large accelerated filer,” “accelerated filer,” “smaller reporting company,” and "emerging growth company" in Rule 12b-2 of the Exchange Act.
Smaller reporting company ☐ Emerging growth company ☐
If an emerging growth company, indicate by check mark if the registrant has elected not to use the extended transition period for complying with any new or revised financial accounting standards provided pursuant to Section 13(a) of the Exchange Act. ☐
Indicate by check mark whether the registrant has filed a report on and attestation to its management's assessment of the effectiveness of its internal control over financial reporting under Section 404(b) of the Sarbanes-Oxley Act (15 U.S.C. 7262(b)) by the registered public accounting firm that prepared or issued its audit report. ☒
If securities are registered pursuant to Section 12(b) of the Act, indicate by check mark whether the financial statements of the registrant included in the filing reflect the correction of an error to previously issued financial statements. ☐
Indicate by check mark whether any of those error corrections are restatements that required a recovery analysis of incentive-based compensation received by any of the registrant's executive officers during the relevant recovery period pursuant to §240.10D-1(b). ☐
Indicate by check mark whether the registrant is a shell company (as defined in Rule 12b-2 of the Exchange Act). Yes ☐ No ☒
At March 29, 2025, the aggregate market value of the registrant’s Common Stock, Class A Common Stock and Class B Stock held by non-affiliates of the registrant was approximately $311.9 million, $1.6 billion and $69,000 , respectively.
At November 19, 2025, the number of shares outstanding of the registrant’s Common Stock was 9,650,221 and the number of shares outstanding of Class A Common Stock was 51,080,111 . In addition, on such date, the registrant had outstanding 1,602,374 shares of its Class B Stock, which are convertible into Common Stock on a share-for-share basis.
DOCUMENTS INCORPORATED BY REFERENCE
Central Garden & Pet Company
Index to Annual Report on Form 10-K
For the fiscal year ended September 27, 2025
| Page | ||||||||
| PART I | ||||||||
| Item 1. | ||||||||
| Item 1A. | ||||||||
| Item 1B. | ||||||||
| Item 1C. | ||||||||
| Item 2. | ||||||||
| Item 3. | ||||||||
| Item 4. | ||||||||
| PART II | ||||||||
| Item 5. | ||||||||
| Item 6. | ||||||||
| Item 7. | ||||||||
| Item 7A. | ||||||||
| Item 8. | ||||||||
| Item 9. | ||||||||
| Item 9A. | ||||||||
| Item 9B. | ||||||||
| Item 9C. | ||||||||
| PART III | ||||||||
| Item 10. | ||||||||
| Item 11. | ||||||||
| Item 12. | ||||||||
| Item 13. | ||||||||
| Item 14. | ||||||||
| PART IV | ||||||||
| Item 15. | ||||||||
| Item 16. | ||||||||
i
FORWARD-LOOKING STATEMENTS
This Form 10-K includes “forward-looking statements.” Forward-looking statements include statements concerning our plans, objectives, goals, strategies, future events, future revenues or performance, projected cost savings, capital expenditures, financing needs, plans or intentions relating to acquisitions, our competitive strengths and weaknesses, our business strategy and the trends we anticipate in the industries and markets in which we operate and other information that is not historical information. When used in this Form 10-K, the words “estimates,” “expects,” “anticipates,” “projects,” “plans,” “intends,” “believes” and variations of such words or similar expressions are intended to identify forward-looking statements. All forward-looking statements, including, without limitation, our examination of historical operating trends, are based upon our current expectations and various assumptions. Our expectations, beliefs and projections are expressed in good faith, and we believe there is a reasonable basis for them, but we cannot assure you that our expectations, beliefs and projections will be realized.
There are a number of risks and uncertainties that could cause our actual results to differ materially from the forward-looking statements contained in this Form 10-K. Important factors that could cause our actual results to differ materially from the forward-looking statements we make in this Form 10-K are set forth in this Form 10-K, including the factors described in the section entitled “Item 1A – Risk Factors.” If any of these risks or uncertainties materializes, or if any of our underlying assumptions are incorrect, our actual results may differ significantly from the results that we express in or imply by any of our forward-looking statements. We do not undertake any obligation to revise these forward-looking statements to reflect future events or circumstances, except as required by law. Presently known risk factors include, but are not limited to, the following factors:
•economic uncertainty and other adverse macroeconomic conditions, including a potential recession or inflationary pressure;
•impacts of tariffs or a trade war;
•risks associated with international sourcing;
•fluctuations in energy prices, fuel and related petrochemical costs;
•declines in consumer spending and the associated increased inventory risk;
•seasonality and fluctuations in our operating results and cash flow;
•adverse weather conditions and climate change;
•the success of our Central to Home strategy and our Cost and Simplicity agenda;
•fluctuations in market prices for seeds and grains and other raw materials, including the impact of significant declines in grass seed market prices on our inventory valuation;
•risks associated with new product introductions, including the risk that our new products will not produce sufficient sales to recoup our investment;
•dependence on a small number of customers for a significant portion of our business;
•consolidation trends in the retail industry;
•supply shortages in pet birds, small animals and fish;
•potential credit risk associated with certain brick and mortar retailers in the pet specialty segment;
•reductions in demand for our product categories;
•competition in our industries;
•continuing implementation of an enterprise resource planning information technology system;
•regulatory issues;
•potential environmental liabilities;
•access to and cost of additional capital;
•the impact of product recalls;
•risks associated with our acquisition strategy, including our ability to successfully integrate acquisitions and the impact of purchase accounting on our financial results;
•potential goodwill or intangible asset impairment;
•the potential for significant deficiencies or material weaknesses in internal control over financial reporting, particularly of acquired companies;
ii
•our dependence upon our key executives;
•our ability to recruit and retain members of our management team and employees to support our businesses;
•potential costs and risks associated with actual or potential cyberattacks;
•our ability to protect our trademarks and other proprietary rights;
•litigation and product liability claims;
•the impact of new accounting regulations and the possibility our effective tax rate will increase as a result of future changes in the corporate tax rate or other tax law changes;
•potential dilution from issuance of authorized shares; and
•the voting power associated with our Class B stock.
MARKET, RANKING AND OTHER DATA
The data included in this Form 10-K regarding markets and ranking, including the size of certain markets and our position and the position of our competitors and products within these markets, are based on both independent industry publications, including National Gardening Survey, July 10, 2025; The Freedonia Group U.S. Lawn and Garden Consumables, November 2025; Packaged Facts U.S. Pet Market Outlook, 2025-2026; American Pet Products Association (APPA) National Pet Owners Survey 2025; IBIS World Industry Report Pet Stores in the U.S., September 2025; U.S. Census Bureau; and our estimates based on management’s knowledge and experience in the markets in which we operate. Our estimates have been based on information provided by customers, suppliers, trade and business organizations and other contacts in the markets in which we operate. While we are not aware of any misstatements regarding our market and ranking data presented herein, our estimates involve risks and uncertainties and are subject to change based on various factors, including those discussed under the heading “Risk factors” in this Form 10-K. This information may prove to be inaccurate because of the method by which we obtained some of the data for our estimates or because this information cannot always be verified with complete certainty due to the limits on the availability and reliability of raw data, the voluntary nature of the data gathering process and other limitations and uncertainties inherent in a survey of market size. As a result, you should be aware that market, ranking and other similar data included herein, and estimates and beliefs based on that data, may not be reliable. We cannot guarantee the accuracy or completeness of such information contained herein.
TRADEMARKS, SERVICE MARKS AND TRADE NAMES
We own or have rights to use trademarks, service marks and trade names in connection with the operation of our business. In addition, our names, logos and website names and addresses are or include our service marks or trademarks. Other trademarks, service marks and trade names appearing in this Form 10-K are the property of their respective owners. Some of the trademarks, service marks and trade names referred to in this Form 10-K may be listed without the ® or ™ symbols, but the absence of such symbols does not indicate whether or not they are registered. We will assert, to the fullest extent under applicable law, our rights or the rights of the applicable licensors to these trademarks, service marks and trade names.
iii
PART I
Item 1. Business
Our Company
Central Garden & Pet Company (“Central”) is a market leader in the U.S. pet and garden industries. For more than 40 years, we have delivered innovative, trusted solutions that help lawns grow greener, gardens bloom bigger, pets live healthier, and communities grow stronger. We operate through two reportable segments: Pet and Garden.
Our Pet segment offers a broad range of products for dog and cat supplies, including treats and chews, toys, beds and containment, grooming items, waste management and training pads. We also provide supplies for aquatics, small animals, reptiles and pet birds, such as toys, enclosures, habitats, bedding, food and supplements, equine and livestock products, animal and household health solutions and insect control items. This segment also includes live fish and small animals as well as outdoor cushions. Products are sold under well-recognized brands including Aqueon®, Best Bully Sticks®, Cadet®, C&S®, Comfort Zone®, Farnam®, Four Paws®, Kaytee®, Nylabone®, Zilla® and Zoëcon®.
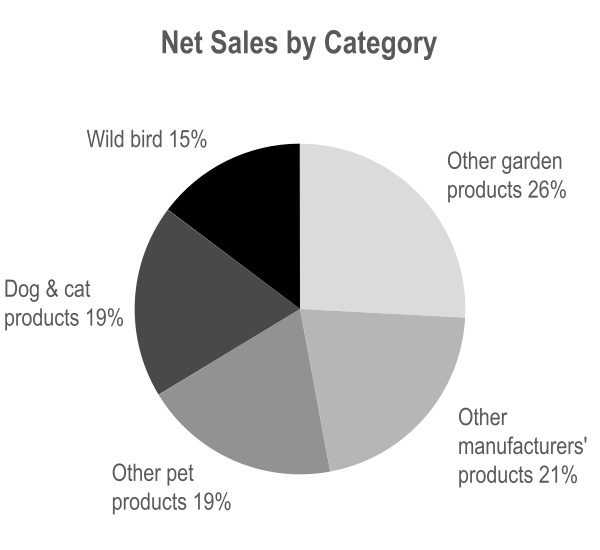
Our Garden segment includes lawn and garden consumables such as grass seed; vegetable, flower and herb packet seed; wild bird feed, bird houses and other birding accessories; weed, grass, and other herbicides, insecticide and pesticide products; fertilizers and live plants. Brands in this segment include 3D®, Amdro®, Ferry-Morse®, Pennington® and Sevin®.
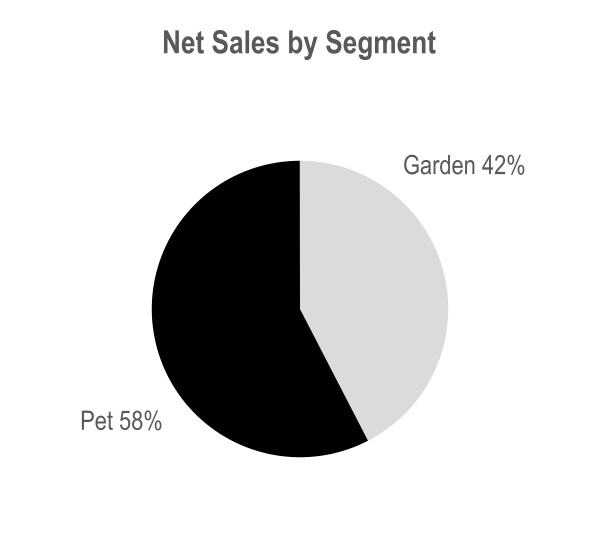
The charts below present product classes that accounted for approximately 10% or more of our consolidated net sales and the percentage of net sales represented by segment for fiscal 2025.
Strategy
Our Central to Home strategy reflects our purpose of nurturing happy and healthy homes and our ambition to lead the pet and garden industries. Our goal is to grow net sales, operating income and cash flows by developing innovative products, expanding market share, acquiring complementary businesses and partnering with our customers to grow the categories we serve. We manage our business with a long-term view, confident that delivering on this strategy will generate sustainable value for all stakeholders. To achieve this, we leverage our competitive strengths and favorable industry dynamics by executing against five strategic pillars designed to drive long-term growth.
Consumer: Build and Grow Brands that Consumers Love
We are focusing on developing differentiated new products and reinvesting some of our annual cost savings into brand building and demand creation to deliver sustainable organic growth and expand market share. To deepen our understanding of consumers, the products and features they value, and how they make their purchasing decisions, we are investing in consumer insights, data analytics, and research and development. These efforts are fueling our product innovation pipeline. Recognizing that more consumers research and buy products online, we are further enhancing our digital capabilities to meet them where they are. Recent marketing initiatives, including our Farnam “Everything for the Ride”, Nylabone’s 70th birthday campaign and DoMyOwn’s “Chief Solutions Officer” initiative with Richard Karn have delivered promising results, accelerating growth and driving share gains across multiple brands.
1
Customer: Win with Winning Customers and Channels
We are building on our strong customer relationships by developing and executing winning category growth strategies. We produce both branded and private label products for our customers as well as distribute third-party brands that give our retail partners a breadth of selection from ultra-premium to value offerings. Today's convenience-oriented consumers increasingly rely on eCommerce channels, including pure-play, omnichannel and direct-to-consumer, as part of their shopping routine. To meet this demand, we continue to expand our digital and eCommerce capabilities while ensuring the right policies, products and programs enable all channels to compete effectively. At the same time, we are optimizing our supply chain for high-demand eCommerce items, ensuring customer and consumer availability requirements are fulfilled at optimal cost. We are also investing in sales planning, net revenue management and price pack architecture to strengthen our position across the marketplace.
Central: Fortify the Central Portfolio
We manage each business based on clearly articulated strategies that establish its role within our portfolio. Profitability and growth potential are regularly assessed, with some businesses managed for top-line growth and others focused on cost efficiency and maximizing operating income.
Our portfolio spans attractive, broadly defined pet and garden markets, and we aim to strengthen it through both organic growth and acquisitions. Our M&A priorities include building scale in our core categories, expanding into priority adjacencies, filling whitespaces and enhancing key capabilities such as digital and eCommerce. We generally target growth- and margin-accretive, brand-focused companies led by strong management teams. Recent examples include our fiscal 2023 acquisition of TDBBS, LLC ("TDBBS"), a leader in the attractive pet treat segment with robust eCommerce capabilities. We are equally committed to exiting businesses where sustainable profitability cannot be achieved. For example, in fiscal 2023 we divested our low-margin distribution business servicing the independent garden channel.
Grounded in our purpose to nurture happy and healthy homes, we are also focused on building a more sustainable future. Our Central Impact program, centered on protecting our planet, cultivating our communities, and empowering our employees, reflects both our responsibility and our approach to corporate sustainability.
Cost: Reduce Cost to Improve Margins and Fuel Growth
We are simplifying our operations and improving efficiency across the organization while meeting the needs of both existing and new customers. Our Cost and Simplicity agenda addresses procurement, logistics, manufacturing, portfolio optimization and administrative functions. The program is designed to reduce complexity by streamlining our product assortment, consolidating plants and logistics centers, lowering cost of goods sold through improved logistics and procurement, and reducing administrative costs through scale and efficiency. We are also shifting our focus to our higher-margin, higher-growth branded pet and garden consumer products. As part of these efforts, we have consolidated portions of our dog and cat treat and toy operations, combined multiple garden manufacturing facilities, merged our outdoor cushion business with our pet bed business to leverage synergies in sourcing, manufacturing and innovation, consolidated legacy garden distribution locations into modern fulfillment centers, exited our pottery business and sold our U.K. operations.
Culture: Strengthen Our Entrepreneurial Business Unit-Led Growth Culture
Our values, established by leaders across the organization, are the foundation of our culture, and at the heart of every decision we make. Known as “The Central Way,” these principles guide how we work, collaborate and lead, shaping both our daily actions and our long-term strategy. We believe that a strong set of values provides a unifying framework for employees, strengthens our ability to work together, and drives consistent performance. These six values define who we are: We do the right thing. We strive to be the best. We are entrepreneurial. We win together. We grow every day. We are passionate.
Employee well-being is essential to building a sustainable business and fostering a passionate, engaged and effective team. We advance this priority through our focus on occupational health & safety, inclusion, and learning & development. In fiscal 2023, we implemented a health and safety policy across the organization aimed at preventing all injuries. In fiscal 2024, our Women in Leadership Council, comprising female leaders from across the organization, held its first in-person summit, "We Rise by Lifting Others" creating opportunities for networking and shaping impactful initiatives. We further expanded Council membership to better reflect of our female leadership and introduced a dedicated Women's Leadership Track to our Mentorship Program. In fiscal 2025, we advanced Basecamp, our frontline-manager development program focused on communication and practical leadership. Since its fiscal 2023 launch, we have held more than 20 Basecamp sessions, and 280 managers from manufacturing and distribution sites nationwide have completed the 2.5-day course.
Competitive Strengths
We believe we have a number of competitive strengths that serve as the foundation of our Central to Home strategy, including the following:
2
Broad Portfolio of Leading Brands Across Key Pet and Garden Segments
We are a leader in both the U.S. pet supplies market and the lawn and garden consumables market. Our diversified portfolio spans many of the most recognized brands in their categories, including Aqueon in aquatics, Cadet in dog treats and chews, Farnam in equine, Four Paws in waste management and grooming, K&H in heated pet products, Kaytee in pet bird and small animal, and Nylabone in dog toys and treats as well as Amdro in controls, Ferry-Morse in packet seed and Pennington in wild bird products, grass seed and fertilizer. The majority of our brands have been marketed for over 40 years, establishing deep consumer trust and strong market positions.
Robust Financial Performance
We have demonstrated strength in net sales, earnings and cash flow. Over the past five years, net sales have grown at an average rate of 3.0% annually, driven by both acquisitions and organic growth, while GAAP operating income has grown at an average annual rate of 4.8%. We maintain a strong cash and liquidity position, supported by cash flow from operations and capital raises, providing flexibility to pursue both acquisitions and organic initiatives.
Proven Track Record of Value Enhancing M&A
Since 1992, we have completed more than 60 acquisitions, building a company with approximately $3.1 billion in net sales. These acquisitions have broadened our pet and garden portfolios and strengthened our capabilities. Most recently, in November 2023, we acquired TDBBS, a provider of premium natural dog chews and treats, expanding our presence in bully and collagen sticks, bones and jerky, and enhancing our eCommerce and digital capabilities.
We pursue disciplined, value-focused M&A, typically targeting businesses that expand scale in our core categories, strengthen priority adjacencies, enter whitespaces, or enhance key capabilities such as digital and eCommerce. We are seeking businesses that, in addition to traditional operating synergies, can leverage our expertise and benefit from our low-cost manufacturing and distribution competencies to drive incremental value. We prioritize brand-driven businesses with growth and margin rates above Central’s averages, led by strong management teams committed to remaining post-acquisition. We have a proven track record of integrating acquisitions realizing synergies and driving further organic growth. We continually evaluate our businesses to ensure they meet performance expectations and implement targeted strategies to improve underperformance or reallocate resources where appropriate.
Deep and Diversified Relationships with Retailers
We have long-standing relationships with leading national, regional and independent retailers across brick-and-mortar and online channels. We deliver a wide range of branded products, private label offerings, packaging and merchandising solutions and a high-touch customer service. Major retailers value our national scope and operational capabilities while independent retailers value our premium portfolio and service levels. We believe these strengths have positioned us as one of the largest pet supplies vendors to Costco, Amazon and Walmart, a leading supplier to independent pet retailers in the United States and among the largest lawn and garden consumables vendors to The Home Depot, Walmart and Lowe’s. We also hold a leading position as a supplier of pet and lawn and garden products to the food, drug and mass merchandise channels. In fiscal 2025, Central was recognized as Lowe’s “Vendor Partner of the Year” for the Lawn & Garden division, reflecting the strength of our customer partnerships.
Walmart, our largest customer, accounted for approximately 17% of total net sales in fiscal 2025 and 16% in fiscal 2024. Home Depot, our second largest customer, represented approximately 16% of total net sales in fiscal 2025 and 17% in fiscal 2024. Together with Costco, Lowe's and Amazon these major retailers represented approximately 54% of total net sales in fiscal 2025 and 2024.
Scaled Manufacturing, Sales and Logistics Network
We manufacture the majority of our branded products in our U.S.-based facilities, supplemented by select contract manufacturing arrangements, including an exclusive supply of our registered active ingredient (S)-Methoprene. In addition, we operate manufacturing facilities in Canada and Mexico.
Our pet and garden sales and fulfillment facilities are strategically located across the United States, enabling us to serve both mass-market customers and independent pet specialty retail stores. This network supports traditional brick-and-mortar outlets as well as increasingly omnichannel and online-only retailers. Our integrated logistics system also consolidates products from other manufacturers with our branded products into single shipments. This capability allows us to deliver cost-efficient service, maintain shelf placement, provide timely replenishment, customize retailer programs, and respond quickly to changing customer needs. It also supports rapid product launches, giving immediate visibility to new and acquired brands.
We continue to leverage our dedicated sales force and our sales and extensive logistics networks to expand distribution and grow sales of our branded pet and garden products.
3
Experienced and Entrepreneurial Leadership Team
Our leadership team combines deep Central expertise with broad consumer products industry expertise. This balance fosters an entrepreneurial, business-unit led culture, while maintaining a disciplined approach to execution, which is critical to capturing and maintaining market share.
Pet Segment
Pet Overview
We are one of the leading producers and marketers of branded pet supplies in the United States and also produce a wide range of private label products. Our Pet segment is supported by one of the largest sales and distribution networks in the industry, which provides strategic reach and scale for our brands.
Pet Industry Background
The pet industry encompasses food, supplies, veterinary care, non-medical services, and live animals. We participate primarily in pet supplies as well as in live fish and small animal categories. The pet supplies segment includes dog and cat treats, chews, toys, beds, containment, grooming products, waste management solutions; aquatics, reptile, small animal, and pet bird supplies, including toys, enclosures, habitats, bedding, food and supplements; as well as equine and livestock products, animal and household health and insect control products; and live fish and small animals. Packaged Facts estimated that in 2025, U.S. retail sales of pet food, treats and chews, supplies, veterinary and non-medical services and live animals will total approximately $158 billion, with about $40 billion attributable to the categories where we compete.
According to Packaged Facts, the U.S. pet supplies market is highly fragmented, with more than 2,500 manufacturers, most operating in single or limited categories. Only about two dozen companies maintain a solid multi-category presence, and brands are even more fragmented within the supplies categories than food and treats. Many smaller players lack in-house sales and logistics capabilities and rely on distributors such as us to reach regional pet specialty chains and independent retailers.
The retail channel is equally diverse, ranging from national chains like Petco, Pet Supplies Plus and PetSmart with over 6,000 locations to the roughly 5,900 independent stores, along with mass merchants, farm & feed outlets, and online retailers, including pet-centric e-tailers like Chewy with unlimited shelf space.
Pure-play eCommerce players continue to gain share, as younger, digitally-native consumers, now entering prime pet-owning years, outspend older generations. Mass-market and pet specialty retailers have expanded their omnichannel capabilities to remain competitive, while independent stores face pressure from these larger more versatile rivals.
Long-Term Pet Industry Characteristics
We expect the U.S. pet supplies market to continue to grow, supported by long-term trends, including demographics shifts, humanization and premiumization of pets, and heightened focus on health and wellness. Pet ownership is evenly split between younger generations (Gen Z and Millennials) and older generations (Gen X and Baby Boomers), with younger owners spending more on their pet. A 2024 Packaged Facts survey found that about 95% of U.S. pet owners view their pet as family, and across all ages, pets are seen as essential companions for affection, fun and mental and physical health, with new research continuing to validate this human-pet bond. For many younger adults, pets are viewed as a precursor to parenthood and are deeply integrated into daily life. Taken together, these long-term trends are driving demand for premium products that promote overall health and well-being.
Branded Pet Products
Our core categories include dog and cat supplies, treats and chews; aquatics and reptile supplies, small animal and pet bird supplies, animal health and equine care; as well as live fish and small animals. Leading brands include Nylabone (dog toys and treats), Kaytee (pet birds and small animal), Farnam (equine), C&S (suet), Aqueon (aquatics), Comfort Zone (cat calming) and Zoëcon® (professional pest control). We also manage Arden Companies® outdoor cushions within our Pet segment due to synergies with our pet bed business.
We continue to drive growth through new product launches, line extensions and entry into adjacent categories. In fiscal 2025, Nylabone introduced new Nubz Chew Treats and released a limited-edition chew toy collection celebrating its 70th birthday. ADAMSTM debuted an innovative plant-based EPA approved flea and tick spray, while Arden launched an exclusive Red Rocks Cushion in collaboration with Denver-based artist Magik Studios and partnered with Alexandra Kay on a signature outdoor cushion collection. In fiscal 2024, Nylabone expanded its Gourmet Style line, Cadet launched rawhide alternatives and new treat flavors, and Paw Love rolled out Simply Smoked chews.
Our products have earned industry recognition. In fiscal 2025, ADAMS won “Flea & Tick Product of the Year” by Pet Innovation Awards and was also recognized as “Best Flea & Tick Solution: 2025 by LUXLife Magazine. Nylabone has been honored with the Pet Insight 2025 Vanguard Award for Chew Toys.
4
Dog and Cat. We are an industry leader in premium edible and non-edible chews, supplements, toys, grooming supplies, beds, containment, training and waste management with brands including Best Bully Sticks, Cadet, Four Paws, Healthy Edibles®, K&H, Healthy PromiseTM, Nylabone, Nubz®, and Paw Love®.
Small Animal and Bird Supplies. We are a leading manufacturer of supplies and food for small animals, pet birds and wild birds. Under Kaytee, we provide fortified diets, habitats, bedding, hay treats and toys, along with suet products for backyard birding under C&S.
Animal Health (Health & Wellness, Equine and Professional). We offer calming solutions under the Comfort Zone brand and flea and tick controls under ADAMS. Our equine portfolio spans fly control, supplements, grooming, deworming, wound care, leather care and rodenticides, marketed under Farnam, Horse Health™ Products, Vita Flex Pro®, and Just One Bite®, as well as sub-brands including Bronco®, Endure®, Horseshoer’s Secret®, IverCare®, Leather New®, PuriShield®, Red Cell®, Sand Clear™, and Vetrolin®. These brands position us as a leader across Equine and Health & Wellness. We are also a leading supplier of insect control products across multiple markets and the sole domestic provider of (S)-Methoprene, an active ingredient used in both professional and consumer insect control applications. Our insect control products are marketed under the Starbar® and Zoëcon® families of brands, along with standalone brands such as Altosid®, Centynal™, ClariFly®IGR, Diacon®, Essentria® and Extinguish®. In addition, we supply (S)-Methoprene to manufacturers of other insect control products, including Frontline Plus.
Aquatics and Reptile. We are a leading manufacturer of aquariums and terrariums along with related fixtures and stands, water conditioners and supplements, water pumps and filters, advanced lighting systems and accessories marketed under the Aqueon, Coralife®, and Zilla brands.
Live Fish and Small Animals. Segrest and SunPet are leading wholesalers of aquarium fish and plants, reptiles and small animals serving pet specialty, mass merchants, aquariums and research institutions.
Outdoor cushions. Arden-branded and private label outdoor cushions are sold across major retailers both in-store and online, using Arden's EverTru®-branded outdoor fabric and OceanTex™ fabrics, the latter made from up to 100% recycled materials, including reclaimed ocean plastic and fishing nets.
Pet Sales and Distribution Network
Our U.S. sales and distribution network supports almost 10,000 retailer locations and over 5,600 veterinary offices, with services ranging from shelf placement and replenishment, to tailored retailer programs, product launches and exposure for acquired brands. By consolidating proprietary and third-party brands into single shipments, we help independent retailers operate more cost effectively.
Pet Sales and Marketing
Our sales strategy is designed to maximize market share across retail channels, including club, regional and national specialty pet stores, independent, food, drug and mass, grocery, farm & feed and eCommerce. We also serve the professional market with insect control and health and wellness products for use by veterinarians, municipalities, farmers and equine product suppliers. Costco accounted for approximately 15% of our Pet segment's net sales in fiscal 2025, and 14% in fiscal 2024. Amazon, Walmart, Petco and Kroger are also significant customers.
Sales resources are structured to optimize coverage:
•Category- and channel-based sales teams
•Dedicated account teams for our largest customers
•Account managers for regional chains
•Territory managers for independents
•Specialists for professional and equine markets
Our marketing strategy is consumer-, brand- and channel-driven, with value creation centered on innovation, product quality and performance, premium packaging, product positioning and consumer relevance. We work closely with our customers to identify their needs, co-develop strategies, and deliver programs that span digital execution, print, broadcast and direct mail. We continue to invest in talent, innovation, brand building, digital capabilities and eCommerce as these are critical to our ambition to lead in the pet segment.
In fiscal 2025, the Davey Awards recognized Central Life Sciences' “Monster Bug” Campaign – Integrated Campaign B2B with a SILVER award for excellence in marketing and advertising. Farnam updated its loyalty program, now called Farnam Rewards, to offer an improved customer experience. In fiscal 2024, Farnam partnered with country music trio The Castellows to launch the brands' new logo across all marketing and point of sale channels, including a refreshed Amazon storefront. At the 2024 Global Pet Expo, D&D Commodities earned third place in the “Best in Show” category for its Wild Delight Squirrel Away Zero-Waste bird feed while our Reptifauna bioactive plants won second place in the Reptile category. In addition, Barkworthies' new floor display received first place in the “Point of Purchase category” at SuperZoo.
5
Pet Competition
The pet supplies industry is highly competitive and increasingly consolidated. Our brands compete with national and regional branded players as well as private label products, with Mars, Inc., Spectrum Brands and the J.M. Smucker Co. among our largest competitors. Competition is driven by brand recognition, innovation, packaging, quality and service. Our distribution network also competes with Animal Supply Co., Phillips Pet Food & Supplies and smaller local and regional distributors, with differentiation based on selection, price, service and relationships.
Garden Segment
Garden Overview
We are a leading provider in the U.S. consumer lawn and garden consumables market, offering a broad portfolio of premium and value-oriented branded products, as well as private label solutions for key customers. Our Garden segment is further supported by a strategically designed sales and distribution network that enhances brand reach and performance.
Garden Industry Background
The garden industry includes consumables such as grass and other seeds, fertilizer, controls, live plants, wild bird products as well as soil and mulch, and durables such as landscaping and decorative products including pottery, outdoor furniture, water features, lighting, arches and trellises. The total lawn and garden consumables industry in the United States is estimated by Packaged Facts, the Freedonia Group, Numerator and internal estimates to be approximately $33 billion in annual retail sales in 2025, including grass and other seeds, fertilizer, controls, live goods, wild bird products as well as soil and mulch. We estimate the annual retail sales of the lawn and garden consumables market in the categories in which we participate to be approximately $32 billion.
The lawn and garden consumables market is highly concentrated with most products sold to consumers through a number of distribution channels, including home centers, mass merchants, independent nurseries and hardware stores. Home and garden centers and mass merchants typically carry multiple premium and value brands.
Long-Term Garden Industry Characteristics
Following the surge in demand during the COVID-19 pandemic, the lawn and garden industry is adjusting to a new baseline marked by ongoing volatility. Supply chain challenges, shifting weather patterns, and retailer destocking have added uncertainty. Nonetheless, overall industry sales in 2025 are expected to remain above 2019 pre-pandemic levels, according to Freedonia Group estimates. Consumer interest in gardening, lawn care, and outdoor recreation remains strong, supported by lifestyle and demographic shifts. These trends are creating opportunities in areas such as convenience (easy-to-use products and smaller package sizes), premiumization, customization, urban gardening, sustainability and the transformation of large grass spaces into lower-maintenance planned gardens. Engagement is particularly strong among younger consumers: Millennials and Gen Z’s demonstrate high participation in gardening and houseplant ownership, with Millennials standing out as the largest group of gardeners and a key driver of the growing interest in outdoor living.
Branded Lawn and Garden Products
Our core lawn and garden consumables portfolio includes grass seed, wild bird products, lawn and garden care products (such as fertilizers, insect control products), live plants and packet seed designed to help consumers grow their lawns greener and gardens bloom bigger. The Pennington brand is one of the largest names in grass seed, wild bird feed and birding accessories. Ferry-Morse is a leader in vegetable, herb and flower packet seed, while Amdro represents a strong portfolio of pest and weed control products.
We continue to expand our portfolio through new product introductions, adding both extensions to established lines and entirely new categories. In fiscal 2025, Ferry-Morse unveiled innovative flower seed mixes and new varieties, while Pennington introduced a water-soluble all-purpose plant food. In fiscal 2024, Ferry-Morse launched its Colossal Seed collection, producing vegetables at least twice the average size, and broadened its organic selection to over 100 varieties of vegetables, fruit and herbs.
Grass Seed. We are a leading producer of cool and warm season grass seed varieties and mixtures for residential and professional use, as well as forage and wildlife blends. Products are sold under the Pennington brand and sub-brands including Lawn Booster, One Step Complete®, Rackmaster®, Slopemaster®, Smart Seed, Smart Patch, The Rebels® and others, along with private label offerings. Pennington’s seed coating and conditioning facilities rank among the largest and most advanced in the industry.
Wild Bird. We are the leading supplier of wild bird feed, sold under Pennington, 3-D® Pet Products and Wild Delight®. Many branded blends are enhanced with proprietary vitamins and minerals; for example, Pennington Bird-Kote® seals each seed with a nutritious coating to support avian health. We also manufacture bird feeders, bird houses and accessories.
Fertilizer and Controls. We produce a wide range of fertilizers, soil supplements and pest control products, in both granular and liquid form. Brands include Alaska® Fish Fertilizer, Ironite®, Pennington, Pro Care® and Superthrive® as well as private and controlled labels. Our weed, moss, insect and pest control products are marketed under brand names such as Amdro, Corry’s®, Daconil®, IMAGE®, Knockout™, Lilly Miller®, Moss Out®, Over-N-Out®, Rootboost™ and Sevin.
6
Live Plants. Through Bell Nursery, we serve as the primary supplier of high-quality flowers, trees, shrubs and other plants to The Home Depot stores in the Northeast and Mid-Atlantic regions, producing and shipping tens of millions of annuals, perennials and indoor plants each year, along with select offerings we do not grow, such as orchids.
Packet Seed. We are a leading provider of packet seeds and seed starters across vegetables, herbs and flowers, sold under American Seed®, Ferry-Morse, Jiffy®, Livingston®, McKenzie® Seed and other well-known brands.
Garden Sales and Logistics Network
Our sales and logistics network not only promotes our proprietary brands but also provides critical access to leading national retail chains. Through this network, we secure and maintain premium shelf placement, ensure timely product replenishment, customize retailer programs, and respond quickly to evolving customer and retailer needs. It also enables the rapid launch of new products, provides valuable market intelligence and supports the identification of potential acquisition opportunities. In addition to distributing our own branded products, the network also sells complementary lawn and garden supplies from other manufacturers. By consolidating these products into single shipments, we offer select national retail chains a cost-effective solution to meet their lawn and garden needs.
Garden Sales and Marketing
Our marketing strategy balances both premium and value offerings. For premium products, we emphasize performance, innovation, quality, upscale packaging and strong retail shelf placement. For value products, we highlight dependable quality and efficacy at a more accessible price point.
In fiscal 2025, Image® Herbicides introduced a bold new brand identity with redesigned packaging and refreshed positioning. DoMyOwn strengthened its connection with DIY consumers by welcoming television personality and home improvement expert Richard Karn as Chief Solutions Officer. Amdro expanded its visibility by sponsoring Brandon Jones in the NASCAR CRAFTSMAN® Truck Series™, following a 2024 brand modernization that introduced eye-catching packaging and simplified, consumer-relevant claims.
Our customer base includes home improvement centers, food, drug and mass merchants, as well as professional end users. In fiscal 2025 and 2024, sales to The Home Depot accounted for approximately 37% and 38%, Walmart represented approximately 29% and 27%, and Lowe’s represented approximately 14% and 15% of our Garden segment’s net sales, respectively.
To maximize in-store placement and visibility, we deploy:
•Dedicated sales forces representing our brand portfolio
•A retail sales and logistics network providing in-store training and merchandising during the peak spring and summer seasons
•Account managers and sales teams located near key customers
•Selected independent distributors
We also continue to invest in talent, digital capabilities and eCommerce, recognizing their critical role in driving growth and strengthening our leadership in the Garden segment.
Garden Competition
The lawn and garden consumables industry is intensely competitive, with numerous national, regional and private label suppliers. Our turf and forage grass seed, fertilizers, pesticides and combination products compete primarily with offerings from The Scotts Miracle-Gro Company, while Spectrum Brands and S.C. Johnson & Son, Inc. represent major competitors in yard and household insecticides. Within this environment, our Garden segment differentiates itself through a balanced portfolio of premium and value brands, a commitment to quality and service, competitive pricing and the advantage of efficient, low-cost manufacturing.
Seasonality
Demand for our pet supplies products is generally steady throughout the year, except for pest control items, which are seasonal. By contrast, our lawn and garden consumables business is highly seasonal, with roughly two-thirds of annual net sales generated in our second and third fiscal quarters. We build inventory in line with projected demand and typically fill customer orders within a few days, resulting in an immaterial backlog of unfilled orders. Working capital requirements, including inventory and receivables, are funded primarily through operating cash flows and supplemented as needed by short-term borrowings under our revolving credit facility. Additional details on our liquidity, working capital management, cash flow and financing activities, can be found in Liquidity and Capital Resources, and Note 11, Long-Term Debt, included in this Form 10-K.
Sources and Availability of Raw Materials
We source most of our raw materials from multiple suppliers; however, one key input used to manufacture (S)-Methoprene is obtained from a single supplier. To mitigate supply risk, we maintain inventories of both (S)-Methoprene and this raw material. A prolonged disruption in supply could temporarily delay product shipments and adversely impact the financial performance of our Pet segment.
7
The primary ingredients for our fertilizer and insect and weed control products include both commodity and specialty chemicals, such as urea, potash, phosphates, herbicides, insecticides and fungicides, whose prices are subject to fluctuations driven by supply and demand dynamics, inflation, and regulatory factors. We actively monitor and evaluate our supplier network to ensure quality, cost-effectiveness, and sufficient manufacturing capacity.
For our bird feed products, essential raw materials include bulk commodity grains such as millet, milo and sunflower seeds, which we procure from large national commodity companies and local grain cooperatives. To secure supply and manage cost, we enter into forward contracts for a portion of our anticipated grain and seed requirements, fixing quantities and often prices at the time of commitment. While we have not experienced significant supply interruptions, we remain exposed to price volatility on any volumes not covered by fixed-price contracts.
Patents, Trademarks and Other Proprietary Rights
We hold numerous patents in the United States and abroad, with additional patent applications currently pending. While we view the development of patents through innovative research and the maintenance of an active patent portfolio as beneficial to our business, we do not consider any single patent to be critical to our operations. Beyond patents, our intellectual property includes a wide range of active ingredient registrations, end-use product registrations and trade secrets. We also own an extensive collection of trademarks, service marks, trade names and logotypes. Many of these trademarks are registered, and for those that are not, we rely on our common law trademark rights to protect our brand identity.
Human Capital Management
Every Central team member plays a vital role in our success and in advancing our purpose. As of September 27, 2025, we had over 6,000 employees, including about 5,700 full-time and 300 part-time employees. To meet the heightened seasonal demand in our lawn and garden business, we also hire a significant number of temporary employees between February and June. The majority of these are hourly workers. With the exception of approximately 100 employees at our facilities in Puebla, Mexico and Brandon, Canada, our workforce is not represented by labor unions. In fiscal 2025, the attrition rate among our non-seasonal full-time and part-time workforce was 29%.
We are committed to attracting, developing and retaining an inclusive workforce, which we view as essential to our continued growth and long-term success. Women make up 41% of our non-seasonal workforce and increasing opportunities for women remains a key priority. Women hold 35% of leadership positions, including managers, directors and senior executives, and serve in critical roles across the organization. These include our Senior Vice President of Human Resources, Senior Vice President Pet Consumer Marketing, Vice President Operations, Vice President Garden Digital Marketing, Vice President Investor Relations & Corporate Sustainability, Vice President Tax, Vice President Central Service Center, Vice President Garden eCommerce Sales, Vice President Sales (Walmart & Target), Vice President Health & Wellness and Vice President Pet Sales.
Supporting the financial security and well-being of our employees is also central to our human capital strategy. We offer competitive compensation, consisting of either a base salary or hourly wages. In addition, eligible employees receive a discretionary annual 401k employer contribution and may participate in our bonus program, which is tied to the performance of our businesses against defined metrics as well as individual contributions. We also grant long-term equity awards to eligible employees through both annual and individual grants, which serve to attract and retain key talent, reward performance and align employees' interest with the success of the Company. To further promote employee well-being, we provide comprehensive health benefits including medical and dental coverage, as well as an advanced wellness program designed to create sustainable life-style habits.
Employee development is a strategic priority for us. We provide a wide array of training and career development resources, including a robust online learning platform, a mentoring program, and a tuition reimbursement program that helps fund undergraduate and advanced degrees for eligible employees. Succession planning and talent development are ongoing processes at all levels of the Company, with our Board actively engaged. Our Senior Vice President of Human Resources, who reports directly to the Chief Executive Officer, collaborates with management to evaluate and develop internal talent for future leadership positions. We also prioritize leadership quality when evaluation acquisitions, ensuring continuity be securing commitments from key management teams.
We hold ourselves to high standards in occupational health and safety. Incidents are recorded, reported and investigated to determine root cause, and we set new annual safety targets to drive continuous improvement. Compared to the prior year, we’ve reduced our recordable incident rate by nearly 30% in fiscal 2025. We continue to invest in safety and operational excellence to ensure progress and protect the well-being of our workforce.
Regulatory Considerations
Many of the products we manufacture or distribute are subject to local, state, federal and foreign laws and regulations. These regulations are often complex and subject to change. For example, in the United States, all pesticides must be registered with the United States Environmental Protection Agency (“EPA”), as well as individual states before they can be sold. Fertilizer products require registration with state Departments of Agriculture, while grass and other seeds are subject to both state and federal labeling regulations. Before any international sales, all foreign agency requirements for shipment and labeling must also be met.
8
The Food Quality Protection Act (“FQPA”) establishes a safety standard for food-use pesticides: a reasonable certainty that no harm will result from the cumulative effects of pesticide exposure. Under this Act, the EPA evaluates the cumulative risks from both dietary and non-dietary exposures to pesticides. Any pesticides in our products that are approved for use on foods are reviewed by the EPA as part of this non-dietary exposure risk assessment.
Additionally, the use of certain pesticide and fertilizer products is regulated by various environmental and public health agencies at the local, state, federal and international level. These regulations may restrict use to certified or professional applicators, limit use to specific sites (e.g., prohibiting application on sod farms or golf courses), require property posting or advance notification of neighbors, or prohibit the use of specific ingredients altogether.
Pet food products are regulated under federal, state and local laws, including the federal Food Safety Modernization Act (“FSMA”), which grants regulatory authorities the power to recall or require relabeling of products. Several new FSMA regulations have taken effect in recent years.
Environmental laws at the local, state, federal and foreign levels also impose obligations to remediate contaminated properties or pay for associated clean-up costs, often extending liability to parties that did not cause the contamination. Over the course of our extensive acquisition history, we have obtained a number of manufacturing and distribution facilities, most of which have not undergone Phase II environmental testing to determine whether contamination is present.
Packaging is facing heightened scrutiny from state governments. Multiple states are advancing laws to curb single-use plastics and to implement extended producer responsibility (EPR) programs—frameworks that shift the cost of packaging disposal from municipalities to manufacturers to strengthen the recycling ecosystem. These EPR programs commonly set targets and require reporting on areas such as post-consumer recycled content usage, compostable packaging, overall material reduction, and refill strategies.
Corporate Sustainability
The long-term success of our business depends on protecting the planet, supporting the communities we serve, and providing our employees with a safe, healthy and rewarding workplace. Corporate sustainability is embedded in our long-term enterprise roadmap and brought to life through our Central Impact strategy. Our 2022-2023 Impact Report details our commitment and progress in protecting the planet, cultivating communities and empowering employees, and is available on our website at www.central.com. Central has disclosed its environmental impact through the Carbon Disclosure Project ("CDP") annual survey since 2022.
Nylabone has been recognized for its leadership in sustainability, winning the 2025 AmeriStar Sustainable Packaging Award for its new blister-free design. In fiscal 2024, Nylabone also received accreditation from the Pet Sustainability Coalition (PSC) as a sustainably led and measured business, driving positive impact for pets, people, and the planet.
Information About Our Executive Officers
The following table sets forth the name, age and position of our executive officers as of November 24, 2025.
| Name | 1 | Age | Position | |||||||||||
| William E. Brown | 84 | Chairman of the Board | ||||||||||||
| Niko Lahanas | 57 | Chief Executive Officer | ||||||||||||
| John E. Hanson | 60 | President, Pet Consumer Products | ||||||||||||
| Brad Smith | 59 | Chief Financial Officer | ||||||||||||
| J.D. Walker | 67 | President, Garden Consumer Products | ||||||||||||
| George Yuhas | 73 | General Counsel & Secretary | ||||||||||||
William E. Brown. Mr. Brown has been our Chairman since October 2019, having previously served in this capacity from 1980 to 2018. He was our Chief Executive Officer from 1980 to June 2003 and from October 2007 to February 2013. From 1977 to 1980, he was Senior Vice President of Vivitar Corporation, responsible for Finance, Operations and Research & Development. From 1972 to 1977, he worked at McKesson Corporation, overseeing its 200-site data processing organization. Mr. Brown spent the first 10 years of his career at McCormick, Inc. in manufacturing, engineering and data processing.
Nicholas "Niko" Lahanas. Mr. Lahanas became our Chief Executive Officer in September 2024. He previously served as Chief Financial officer from May 2017 until September 2024, Senior Vice President of Finance and Chief Financial Officer of our Pet segment from April 2014 to May 2017, and Vice President of Corporate Financial Planning & Analysis from October 2011 to March 2014. From March 2008 to October 2011, he was Director of Business Performance, focusing on business unit profitability, and from October 2006 to March 2008 he was Finance Manager in our Garden segment. Prior to joining Central, Mr. Lahanas worked in private equity and investment banking for more than eight years.
John E. Hanson. Mr. Hanson has served as President of Pet Consumer Products since August 2019, after serving as a board member during portions of 2018 and 2019. From 2015 to 2017, he was Chief Executive Officer of Oasis Brands, Inc. Beginning in 2013, he provided
9
consulting services for consumer products companies in strategy, operations, and mergers and acquisitions. From 1996 to 2012, he held senior positions at ConAgra, including President of its Frozen Foods Division from 2008 to 2012 and Senior Vice President in Sales from 2006 to 2008.
Bradley "Brad" Smith. Mr. Smith became our Chief Financial Officer in September 2024. He joined Central in 2017 as Chief Financial Officer of our Pet Segment. Before joining Central, he spent 12 years with Delhaize Group (now Ahold Delhaize) in progressively more senior finance roles, including Chief Financial Officer of its European operations. Prior to Delhaize Group, Mr. Smith spent 11 years at Arthur Andersen.
J.D. Walker. Mr. Walker has served as our President of Garden Consumer Products since 2017, overseeing Central's branded garden business, including sales, marketing operations, the controls and fertilizer, grass seed and vendor partner business units, and the retail sales & service team. From 2014 to 2017, he was Executive Vice President and General Manager - Garden Branded Business, and he joined Central in 2011 as Senior Vice President - Garden Sales. Before joining Central, he spent 13 years with Spectrum Brands in senior positions and 17 years with The Gillette Company's Duracell North American Group.
George Yuhas. Mr. Yuhas became our General Counsel in July 2025 and our Secretary in August 2025. From January 2023 to July 2025, he served as a consultant on legal matters. Prior to that, Mr. Yuhas was our General Counsel beginning in March of 2011 and our Secretary from September 2015. Earlier in his career, from 1984 until 2011, he was a partner at Orrick, Herrington & Sutcliffe, LLP, where he specialized in commercial litigation. Mr. Yuhas holds a bachelor’s degree in political science from the University of Chicago and a Juris Doctor from Stanford Law School.
Available Information
Our web site is www.central.com. We make available, free of charge on or through our website, our annual, quarterly and current reports, along with any amendments to those reports, as soon as reasonably practicable after they are electronically filed with or furnished to the Securities and Exchange Commission. The information contained on our website is not incorporated by reference into, and does not form part of, this report.
10
Item 1A. Risk Factors.
This Form 10-K contains forward-looking statements that involve risks and uncertainties. Our actual results could differ materially from those anticipated in these forward-looking statements as a result of factors both in and out of our control, including the risks faced by us described below and elsewhere in this Form 10-K.
You should carefully consider the risks described below. In addition, the risks described below are not the only ones facing us. We have only described the risks we consider to be material. However, there may be additional risks that are viewed by us as not material at the present time or are not presently known to us. Conditions could change in the future, or new information may come to our attention that could impact our assessment of these risks.
If any of the events described below were to occur, our business, prospects, financial condition and/or results of operations could be materially adversely affected. When we say below that something could or will have a material adverse effect on us, we mean that it could or will have one or more of these effects. In any such case, the price of our common stock could decline, and you could lose all or part of your investment in our company.
Risks Affecting our Business
Economic uncertainty and other adverse macro-economic conditions, including interest rate fluctuations and tariffs, may harm our business.
Our revenues and margins are dependent on various economic factors, including interest rates, the potential of an economic recession, trade tariffs, energy costs, consumer attitudes toward discretionary spending, currency fluctuations, rates of inflation and other macro-economic factors which may impact consumer spending. While the rate of inflation moderated during fiscal 2025, and a recession has not materialized, interest rates remain high and the imposition of tariffs on imports by the U.S. administration has resulted in higher input costs. If we are unable to pass through higher input costs by raising the price of our products or altering our sourcing, we may experience organic sales declines and gross margin and operating income declines.
Tariffs or a global trade war could increase the cost of our products, which could adversely impact the competitiveness of our products and our financial results.
During 2025, the U.S. Administration has imposed significant tariffs on goods imported, ranging from a 10% baseline to much higher rates on a variety of imports. In fiscal 2025, less than 15% of our cost of goods sold was from products or materials sourced from outside the United States, primarily from China, Brazil and Mexico. To the extent the United States imposes new or additional tariffs on these or other countries where we or our suppliers source products, or if new or additional tariffs or trade restrictions are implemented by the United States or other countries in connection with a global trade war, the cost of our products manufactured in other countries and imported into the United States could increase significantly, which in turn could adversely affect the demand for these products and have a material adverse effect on our business and results of operations.
High energy prices could adversely affect our operating results.
In fiscal 2025, energy prices remained elevated, resulting in increased costs for fuel and raw materials for many of our products. Energy prices may continue to rise or remain elevated during fiscal 2026. Continued high energy prices could adversely affect consumer spending and demand for our products and increase our operating costs, both of which would reduce our sales and operating income.
A decline in consumers’ discretionary spending or a change in consumer preferences could reduce our sales and harm our business.
Our sales ultimately depend on consumer discretionary spending, which is influenced by factors beyond our control, including high interest rates, the potential for trade tariffs, a return to an inflationary environment or an economic recession, other general economic conditions, the availability of discretionary income and credit, weather, consumer confidence and unemployment levels. Any material decline in consumer discretionary spending could reduce our sales and harm our business. For example, in the last few years, we have seen a decline in demand for durable goods in certain of our categories, resulting in part from the residual effect of inflated demand for durable goods in the early years of the COVID-19 pandemic. Unfavorable economic and market conditions may also place a number of our key retail customers under financial stress, which would increase our credit risk and potential bad debt exposure.
The success of our business also depends in part on our ability to identify and respond to evolving trends in demographics and consumer preferences. Our failure to timely identify or effectively respond to changing consumer tastes, preferences, spending patterns and lawn and garden and pet care needs could adversely affect the demand for our products and our profitability.
Our operating results and cash flow are susceptible to fluctuations.
We expect to continue to experience variability in our net sales, net income and cash flow on a quarterly basis. Factors that may contribute to this variability include:
•the uncertain macro-economic environment, including elevated interest rates and trade tariffs, could lead to a recession, and the impact any of those could have on consumer discretionary spending;
•seasonality and the impact of adverse weather conditions;
•fluctuations in prices of commodity grains and other input costs;
•supply chain and sourcing disruptions, including the volatile geopolitical environment and the potential imposition of trade tariffs on countries from which we import products;
•a return to high inflation and the ability to take pricing actions to mitigate high input costs, including for commodities;
•shifts in demand for lawn and garden and pet products;
•changes in product mix, service levels, marketing and pricing by us and our competitors;
•the effect of acquisitions; and
•the strength of our relationships with key retailers and their buying patterns and economic stability.
These fluctuations could negatively impact our business and the market price of our common stock.
Our lawn and garden sales are highly seasonal and subject to adverse weather and climate change.
Because our lawn and garden products are used primarily in the spring and summer, the Garden business is seasonal. In fiscal 2025, approximately 64% of our Garden segment’s net sales and 57% of our total net sales occurred during our second and third fiscal quarters. Substantially all of the Garden segment’s operating income is generated in this period. Our working capital needs and our borrowings generally peak in our second fiscal quarter because we are generating lower revenues while incurring expenses in preparation for the spring selling season. If cash on hand and borrowings under our credit facility are ever insufficient to meet our seasonal needs or if cash flow generated during the spring and summer is insufficient to repay our borrowings on a timely basis, this seasonality could have a material adverse effect on our business.
Because demand for lawn and garden products is significantly influenced by weather, particularly weekend weather during the peak gardening season, our results of operations and cash flow could also be adversely affected by certain weather patterns such as unseasonably cool or warm temperatures, heavy rains, water shortages or floods. From time to time, we have experienced unfavorable weather during the peak garden season, which adversely impacted our Garden sales. Unfavorable weather during the peak garden season in the future could have a significant adverse effect on the sales and profitability of our lawn and garden business.
Climate change continues to receive increasing global attention. The effects of climate change could include changes in rainfall patterns, water shortages, changing storm patterns and intensities, and changing temperature levels. These changes could over time affect, for example, the availability and cost of raw materials, commodities and energy, which in turn may impact our ability to procure goods or services required for the operation of our business at the quantities and levels we require.
The increase in climate change attention has resulted in evolving policy, legal and regulatory changes which may impose substantial operational and compliance burdens. Collecting, measuring and analyzing information relating to such matters can be costly, time-consuming, dependent on third-party cooperation and unreliable. Furthermore, methodologies for measuring, tracking and reporting on such matters continue to change over time, which requires our processes and controls for such data to evolve as well. Compliance with any new or more stringent laws or regulations, customer reporting requirements, or stricter interpretations of existing laws could require additional expenditures by us or our suppliers, in which case, the costs of raw materials and component parts could increase.
Consumers and businesses may independently change their behavior because of concerns regarding the impact of climate change and public perceptions. For example, consumers may elect to garden less frequently than historic patterns due to the unpredictability of weather patterns. Those consumers who are less directly impacted by climate change may also engage in less gardening due to discomfort or concerns about perceptions stemming from the direct impact of climate change on others. Current or potential retail customers may pull back from all or parts of the lawn and garden category in response to softening consumer demand.
Our failure to adequately manage the political, legal, regulatory, consumer and retail impacts of climate change could have a material adverse effect on our financial condition, results of operations and cash flows.
We are in the process of implementing our Central to Home strategy, which could result in increased expenses over the next few years.
Our Central to Home strategy consists of a comprehensive series of organizational and operational initiatives intended to build and grow our consumer brands, create a leading eCommerce platform and strengthen our relationships with key customers, drive a strong portfolio strategy, reduce costs to improve margins and fuel growth and strengthen our entrepreneurial, business unit-led growth culture. We
expect to continue to implement these initiatives over the next several years. We anticipate continuing to incur substantial costs relating to this strategy in each of the next several years. There can be no assurance that we will be able to successfully execute our Central to Home strategic initiatives or that we will be able to do so within the anticipated time period. During the process of implementation, we will be making substantial investments in our business and will incur substantial transitional costs. These investments and transitional costs may adversely affect our operating results.
If we are unable to execute on our Cost and Simplicity Agenda, our ability to maintain or grow margins may be negatively impacted.
Our Cost and Simplicity agenda involves reducing costs, including procurement, logistics, manufacturing, portfolio optimization and administrative, and reducing complexity through fewer SKUs, plants and distribution centers. Optimizing our supply chain footprint and having the right facilities in the right locations is critical to lowering costs. We plan to simplify our business and improve our efficiency across the organization by rationalizing our footprint, streamlining our portfolio, and improving our cost structure. There can be no assurance that we will be able to successfully execute our Cost and Simplicity agenda or that we will be able to do so within the anticipated time period, which could adversely impact our ability to improve or maintain margins and enhance long-term profitability.
Seeds and grains we use to produce bird feed and grass seed are commodity products subject to price volatility that could have a negative impact on us.
Our financial results are partially dependent upon the cost of raw materials and our ability to pass along increases in these costs to our customers. In particular, our Pennington and Kaytee businesses are exposed to fluctuations in market prices for commodity seeds and grains used to produce bird feed and grass seed. Historically, market prices for commodity seeds and grains have fluctuated in response to a number of factors, including changes in U.S. government farm support programs, changes in international agricultural and trading policies and weather conditions during the growing and harvesting seasons.
To mitigate our exposure to changes in market prices, we enter into purchase contracts for grains, bird feed and grass seed to cover a limited portion of our purchase requirements for a selling season. Since these contracts cover only a portion of our purchase requirements, as market prices for such products increase, our cost of production increases as well. In contrast, if market prices for such products decrease, we may end up purchasing grains and seeds pursuant to the purchase contracts at prices above market.
In the past, periods of high inflation or supply constraints have resulted in higher costs for bird feed and grass seed. Beginning in fiscal 2023, there has been a prolonged oversupply of grass seed, which has resulted in a significant decline in market prices. As a result of this decline, in fiscal 2024, we incurred an approximately $15-$20 million charge to write-down the value of our grass seed inventory. In fiscal 2025, grass seed market prices remained low although the oversupply of grass seed is beginning to moderate. We can provide no assurance as to the timing or extent of our ability to implement price increases in the event of high costs in the future, or our ability to maintain pricing with our retailers in the context of declining costs. We also cannot predict to what extent price increases may negatively affect our sales volume or price decreases may result in further inventory write-downs. As retailers pass along price increases, consumers may shift to our lower margin bird feed, switch to competing products or reduce purchases of wild bird feed products. The same shift in consumer behavior could adversely affect our business in other product categories which experience substantial price increases.
We are subject to significant risks associated with innovation, including the risk that our new product innovations will not produce sufficient sales to recoup our investment.
We believe that our future success will depend upon, in part, our ability to continue to improve our existing products through product innovation and to develop, market and produce new products. We cannot assure you that we will be successful in the introduction, marketing and production of any new products or product innovations, or that we will develop and introduce in a timely manner, improvements to our existing products which satisfy customer needs or achieve market acceptance. Our failure to develop new products or improved formulations and introduce them successfully and in a timely manner could harm our ability to grow our business and could have a material adverse effect on our business, results of operations and financial condition.
We believe that the period of time to gain consumer acceptance of major innovations is longer in the garden industry than in many industries, which compounds the risks generally associated with major new product innovations.
We depend on a few customers for a significant portion of our business.
Walmart, our largest customer in fiscal 2025, represented approximately 17% of total net sales in fiscal 2025 and 16% of total net sales in fiscal 2024 and 2023. Home Depot, our second largest customer in fiscal 2025, represented approximately 16% of total net sales in fiscal 2025, 2024 and 2023. Costco, Lowe's and Amazon are also significant customers, and together with Walmart and Home Depot, accounted for approximately 54% of our net sales in fiscal 2025 and 2024. The market shares of many of these key retailers have increased and may continue to increase in future years.
The loss of, or significant adverse change in, our relationship with any of these key retailers could cause our net sales, operating income and cash flow to decline. The loss of, or reduction in, orders from any significant customer, losses arising from customer disputes
regarding shipments, fees, merchandise condition or related matters, or our inability to collect accounts receivable from any major customer could reduce our operating income and cash flow.
We may be adversely affected by trends in the retail industry.
Our retailer customers have continued to consolidate, resulting in fewer customers on which we depend for business. These key retailers are large and sophisticated with increased buying power and negotiating strength. They are more capable of resisting price increases and can demand lower pricing. Our business may be negatively affected by changes in the policies of our key retailers, such as limitations on access to shelf space, price demands and other conditions. In addition, large retailers have the scale to develop supply chains that permit them to operate with reduced inventories. Consequently, our customers have been implementing inventory destocking and making purchases on a “just-in-time” basis. This requires us to shorten our lead time for production in certain cases and to more closely anticipate demand, which could in the future require the carrying of additional inventories and an increase in our working capital and related financing requirements. This shift to “just-in-time” can also cause retailers to delay purchase orders, which can cause a shift in sales from quarter to quarter. Decisions to move in or out of a market category by leading retailers can also have a significant impact on our business. Additionally, some retailers are increasing their emphasis on private label products. These retailers may also in the future use more of their shelf space, currently used for our products, for their store brand products. While we view private label as an opportunity and supply many private label products to retailers, we could lose sales if key retailers replace our branded products with private label product manufactured by others.
We sell our products through a variety of trade channels with a significant portion dependent upon key retailers, through both traditional brick-and-mortar retail channels and eCommerce channels, including Amazon. The eCommerce channel continues to grow rapidly. To the extent that the key retailers, including retailers in the pet specialty segment, on which we depend lose share to the eCommerce channel, we could lose sales. We continue to make additional investments to access this channel more effectively, but there can be no assurances that any such investments will be successful. If we are not successful in developing and utilizing eCommerce channels that consumers may prefer, we may experience lower than expected revenues.
A significant deterioration in the financial condition of one of our major customers or several smaller customers could have a material adverse effect on our sales, profitability and cash flow. If one or more of these customers were to cancel product orders, become insolvent, or otherwise be unable or fail to pay for our products in a timely manner, our operating results and financial condition could be materially and adversely affected. We continually monitor and evaluate the credit status of our customers and attempt to adjust sales terms as appropriate. Despite these efforts, a bankruptcy filing or liquidation by a key customer could have a material adverse effect on our business, results of operations and financial condition in the future.
If we underestimate or overestimate demand for our products and do not maintain appropriate inventory levels, our results of operations and financial condition could be negatively impacted.
Our ability to manage our inventory levels to meet our customers’ demand for our products is important for our business. Our production levels and inventory management goals for our products are based on estimates of demand, taking into account production capacity, timing of shipments, and inventory levels. If we overestimate or underestimate demand for any of our products during a given season, we may not maintain appropriate inventory levels, which could negatively impact our net sales, profit margins, net earnings, and/or working capital, hinder our ability to meet customer demand, result in loss of customers, or cause us to incur excess and obsolete inventory charges.
Supply disruptions in pet birds, small animals and fish may negatively impact our sales.
The federal government and many state governments have increased restrictions on the importation of pet birds and the supply of small animals. These restrictions have resulted in reduced availability of new pet birds and small animals and thus reduced demand for pet bird and small animal food and supplies. If these restrictions become more severe, or similar restrictions become applicable to pet fish, our future sales of these products would likely suffer, which would negatively impact our profitability. In addition, some countries have experienced outbreaks of avian flu. A significant outbreak in the United States would reduce demand for our pet and wild bird food and negatively impact our financial results.
Our Segrest subsidiary is the largest supplier of aquarium fish in the United States and also supplies pet birds and small animals. The sale of fish, pet birds and small animals subjects us to additional risk, including risks associated with sourcing, developing captive breeding programs, health of the fish, pet birds and small animals supplied by us and future governmental regulation of the sale of fish, pet birds and small animals.
Issues with products may lead to product liability, personal injury or property damage claims, recalls, withdrawals, replacements of products, regulatory actions by governmental authorities that could divert resources, affect business operations, decrease sales, increase costs, and put us at a competitive disadvantage, any of which could have a significant adverse effect on our results of operations and financial condition.
We have experienced, and may in the future experience, issues with products that may lead to product liability, recalls, withdrawals, replacements of products, or regulatory actions by governmental authorities. Product recalls or other governmental regulatory action directed at product sales could result in increased governmental scrutiny, reputational harm, reduced demand by consumers for our products, decreased willingness by retailer customers to purchase or provide marketing support for those products, unavailability or increased cost of insurance, or additional safety and testing requirements. Such results could divert development and management resources, adversely affect our business operations, decrease sales, increase legal fees and other costs, and put us at a competitive disadvantage compared to other manufacturers not affected by similar issues with products, any of which could have a significant adverse effect on our results of operations and financial condition.
Competition in our industries may hinder our ability to execute our business strategy, increase our profitability or maintain relationships with existing customers.
We operate in highly competitive industries, which have experienced increased consolidation in recent years. We compete against numerous other companies, some of which are more established in their industries and have substantially greater revenue and resources than we do. Our products compete against national and regional products and private label products produced by various suppliers. Our largest competitors in the Pet segment are Spectrum Brands, Mars, Inc. and the J.M Smucker Co., and our largest competitors in the Garden segment are Scotts Miracle-Gro, Spectrum Brands and S.C. Johnson.
To compete effectively, among other things, we must:
•develop and grow brands with leading market positions;
•maintain or grow market share;
•maintain and expand our relationships with key retailers;
•effectively access the growing eCommerce channel;
•continually develop innovative new products that appeal to consumers;
•implement effective marketing and sales promotion programs;
•maintain strict quality standards;
•deliver products on a reliable basis at competitive prices; and
•effectively integrate acquired businesses.
Our inability to compete effectively could lead to lower sales volumes, price reductions, reduced profits, losses, or loss of market share which could have a material adverse effect on our business, results of operations and financial condition.
We continue to implement enterprise resource planning information technology systems.
We are incurring costs associated with designing and implementing enterprise resource planning (ERP) software systems and gradually migrating our businesses to one or the other of two systems. The choice of which is to be used for each business is dependent on the needs of the business unit. These two systems are replacing numerous accounting and financial reporting systems, most of which have been obtained in connection with business acquisitions. To date, we have reduced the number of ERP systems from 46 to 6. Capital expenditures for our enterprise resource planning software systems for fiscal 2025 and beyond will depend upon the pace of conversion for those remaining legacy systems. If the balance of the implementation is not executed successfully, we could experience business interruptions or material weaknesses relating to IT controls of acquired companies. For example, in fiscal 2023 we identified two material weaknesses related to our Live Plants and Green Garden businesses whose IT systems had not been fully integrated into our corporate IT control structure. The material weaknesses were resolved during fiscal 2024, but there is no assurance that we may not experience similar IT control issues in the future. If we do not complete the implementation of the project timely and successfully, we may experience, among other things, additional costs associated with completing this project and a delay in our ability to improve existing operations, support future growth and take advantage of new applications and technologies. All of this may also result in distraction of management, diverting their attention from our operations and strategy.
Some of the products that we manufacture and distribute require governmental permits and also subject us to potential environmental liabilities.
Some of the products that we manufacture and distribute are subject to regulation by federal, state, foreign and local authorities. Environmental health and safety laws and regulations are often complex and are subject to change. Environmental health and safety laws and regulations may affect us by restricting the manufacture, sale or use of our products or regulating their disposal. Regulatory or legislative changes may cause future increases in our operating costs or otherwise affect operations. There is no assurance that in the future we may not be adversely affected by such laws or regulations, incur increased operating costs in complying with such regulations or not be subject to claims for personal injury, property damages or governmental enforcement. In addition, due to the nature of our operations and the frequently changing nature of environmental compliance standards and technology, we cannot predict with any certainty that future material capital expenditures will not be required.
In addition to operational standards, environmental laws also impose obligations on various entities to clean up contaminated properties or to pay for the cost of such remediation, often upon parties that did not actually cause the contamination. Accordingly, we may become liable, either contractually or by operation of law, for remediation costs even if the contaminated property is not presently owned or operated by us, or if the contamination was caused by third parties during or prior to our ownership or operation of the property. With our extensive acquisition history, we have acquired a number of manufacturing and distribution facilities, and most of these facilities have not been subjected to Phase II environmental tests to determine whether they are contaminated. Given the nature of the past operations conducted by us and others at these properties, there can be no assurance that all potential instances of soil or groundwater contamination have been identified, even for those properties where an environmental site assessment has been conducted. Future events, such as changes in existing laws or policies or their enforcement, or the discovery of currently unknown contamination, may give rise to future remediation liabilities that may be material.
Deterioration in operating results could prevent us from fulfilling our obligations under the terms of our indebtedness or impact our ability to refinance our debt on favorable terms as it matures.
We have, and we will continue to have, significant indebtedness. As of September 27, 2025, we had total indebtedness of approximately $1.2 billion. This level of indebtedness and our future borrowing needs could have material adverse consequences for our business, including:
•make it more difficult for us to satisfy our obligations with respect to the terms of our indebtedness;
•require us to dedicate a large portion of our cash flow to pay principal and interest on our indebtedness, which would reduce the availability of our cash flow to fund working capital, capital expenditures, acquisitions and other business activities;
•increase our vulnerability to adverse industry conditions, including unfavorable weather conditions or commodity price increases;
•limit our flexibility in planning for, or reacting to, changes in our business and the industries in which we operate;
•restrict us from making strategic acquisitions or exploiting business opportunities;
•place us at a competitive disadvantage compared to competitors that have less debt; and
•limit our ability to borrow additional funds at reasonable rates, if at all.
In addition, since our credit facility bears interest at variable rates, a further increase in interest rates or interest rate margins as defined under our credit agreement will create higher debt service requirements, which would adversely affect our cash flow.
Risks Relating to Acquisitions
Our acquisition strategy involves a number of risks.
We are regularly engaged in acquisition discussions with other companies and anticipate that one or more potential acquisition opportunities, including those that would be material or could involve businesses with operating characteristics that differ from our existing business operations, may become available in the near future. If and when appropriate acquisition opportunities become available, we intend to actively pursue them. Acquisitions involve a number of special risks, including:
•failure of the acquired business to achieve expected results, as well as the potential impairment of the acquired assets if operating results decline after acquisition;
•diversion of management’s attention;
•additional financing, if necessary and available, which could increase leverage and costs, dilute equity, or both;
•the potential negative effect on our financial statements from the increase in goodwill and other intangibles;
•difficulties in integrating the operations, systems, technologies, products and personnel of acquired companies;
•initial dependence on unfamiliar supply chains or relatively small supply partners;
•the potential loss of key employees, customers, distributors, vendors and other business partners of the companies we acquire after the acquisition;
•the high cost and expenses of identifying, negotiating and completing acquisitions; and
•risks associated with unanticipated events or liabilities.
These risks could have a material adverse effect on our business, results of operations and financial condition.
We have faced, and expect to continue to face, intense competition for acquisition candidates, which may limit our ability to make acquisitions and may lead to higher acquisition prices. We cannot assure you that we will be able to identify, acquire or manage profitably additional businesses or to integrate successfully any acquired businesses into our existing business without substantial costs, delays or other operational or financial difficulties. In future acquisitions, we also could incur additional indebtedness or pay consideration in excess of fair value, which could have a material adverse effect on our business, results of operations and financial condition.
If our goodwill, indefinite-lived intangible assets or other long-term assets become impaired, we will be required to record impairment charges, which may be significant.
A significant portion of our long-term assets consists of goodwill and other intangible assets recorded as a result of past acquisitions. We do not amortize goodwill and indefinite-lived intangible assets, but rather review them for impairment on a periodic basis or whenever events or changes in circumstances indicate that their carrying value may not be recoverable. We consider whether circumstances or conditions exist which suggest that the carrying value of our goodwill and other long-lived intangible assets might be impaired. If such circumstances or conditions exist, further steps are required to determine whether the carrying value of each of the individual assets exceeds its fair value. If analysis indicates that an individual asset’s carrying value does exceed its fair value, we would record a loss equal to the excess of the individual asset’s carrying value over its fair value.
The steps required by Generally Accepted Accounting Principles (“GAAP”) entail significant amounts of judgment and subjectivity. Events and changes in circumstances that may indicate that there may be an impairment and that interim impairment testing is necessary include, but are not limited to: competitive conditions; the impact of the economic environment on our customer base and on broad market conditions that drive valuation considerations by market participants; our internal expectations with regard to future revenue growth and the assumptions we make when performing impairment reviews; a significant decrease in the market value of our assets; a significant adverse change in the extent or manner in which our assets are used; a significant adverse change in the business climate that could affect our assets; and significant changes in the cash flows associated with an asset. As a result of such circumstances, we may be required to record a significant charge to earnings in our financial statements during the period in which any impairment of our goodwill, indefinite-lived intangible assets or other long-term assets is determined. Any such impairment charges could have a material adverse effect on our results of operations and financial condition.
During fiscal 2025, 2024 and 2023, we performed evaluations of the fair value of our indefinite-lived trade names and trademarks. Our expected revenues were based on our future operating plan and estimates of market growth or decline for future years. As a result, we recorded a non-cash impairment charge in our Pet segment of $1.0 million in fiscal 2025, $12.8 million in fiscal 2024, and $7.5 million and $3.9 million in our Pet and Garden segments, respectively in fiscal 2023.
As part of our annual goodwill impairment testing, in fiscal 2025 we made a qualitative evaluation about the likelihood of goodwill impairment to determine whether it was necessary to calculate the fair values of our reporting segments under the goodwill impairment test. We completed our qualitative assessment of potential goodwill impairment and determined that it was more likely than not the fair values of our reporting segments were greater than their carrying amount in fiscal 2025, and accordingly, no further testing of goodwill was required in fiscal 2025. In connection with our annual goodwill impairment testing performed during fiscal 2024, we made a qualitative evaluation about the likelihood of goodwill impairment to determine whether it was necessary to calculate the fair values of our reporting segments under the goodwill impairment test. We completed our qualitative assessment of potential goodwill impairment and determined that it was more likely than not the fair values of our reporting segments were greater than their carrying amount in fiscal 2024, and accordingly, no further testing of goodwill was required in fiscal 2024. In connection with our annual goodwill impairment testing performed during fiscal 2023, we elected to bypass the qualitative assessment and proceeded directly to performing the quantitative goodwill impairment test. We completed our quantitative assessment of potential goodwill and determined that it was more likely than not the fair values of our reporting segments were greater than their carrying amounts.
General Risks
Our success depends upon our retaining and recruiting key personnel.
Our performance is substantially dependent upon the continued services of our senior management team. The loss of the services of these persons could have a material adverse effect on our business. In September 2024, our Chief Financial Officer was promoted to Chief Executive Officer and the former chief financial officer of our Pet segment was promoted to our Chief Financial Officer. Our future performance depends on the continued success of our Chief Executive Officer and Chief Financial Officer and our ability to attract and retain skilled employees in all facets of our business, including management and manufacturing and distribution. We cannot assure you that we will be able to retain our existing personnel or attract additional qualified employees in the future.
A significant information security or operational technology incident, including a cyber attack or data breach, could disrupt our operations and adversely impact our operating results, cash flows and reputation.
We rely extensively on information technology (IT) systems, networks and services, including internet and intranet sites, data hosting and processing facilities and technologies, physical security systems and other hardware, software and technical applications and platforms, many of which are managed, hosted, provided and/or used by third parties or their vendors, to assist in conducting our business.
Numerous and evolving information security threats, including advanced persistent cybersecurity threats, pose a risk to the security of our services, systems, networks and supply chain, as well as to the confidentiality, availability and integrity of our data and of our critical business operations. In addition, because the techniques, tools and tactics used in cyber-attacks frequently change and may be difficult to detect for periods of time, we may face difficulties in anticipating and implementing adequate preventative measures or fully mitigating harms after such an attack.
Our and our third-party providers’ IT systems have been, and will likely continue to be, subject to advanced computer viruses or other malicious codes, ransomware, unauthorized access attempts, denial of service attacks, phishing, social engineering, hacking and other cyberattacks. We cannot guarantee that our security efforts or the security efforts of our third-party providers will prevent material breaches, operational incidents or other breakdowns to our or our third-party providers’ IT systems.
A breach of our data security systems or failure of our IT systems may have a material adverse impact on our business operations and financial results. If the IT systems, networks or service providers we rely upon fail to function properly or cause operational outages or aberrations, or if we or one of our third-party providers suffer significant unavailability of key operations, or inadvertent disclosure of, lack of integrity of, or loss of our sensitive business or stakeholder information, including personally identifiable information, and our business continuity plans do not effectively address these failures on a timely basis, we may suffer interruptions in our ability to manage operations and be exposed to reputational, competitive, operational, financial and business harm as well as litigation and regulatory action. If our critical IT systems or back-up systems or those of our third-party vendors are damaged or cease to function properly, we may have to make a significant investment to repair or replace them. These risks can be magnified in companies that we have acquired until we fully integrate their critical IT systems into our internal controls.
In addition, if a ransomware attack or other cybersecurity incident occurs, either internally or at our third-party technology service providers, we could be prevented from accessing our data or systems, which may cause interruptions or delays in our business operations, cause us to incur remediation costs, subject us to demands to pay a ransom or damage our reputation. In addition, such events could result in unauthorized disclosure of confidential information or stakeholder information, including personally identifiable information, and we may suffer financial and reputational damage because of lost or misappropriated information belonging to us or to our partners, our employees, customers and suppliers. Additionally, we could be exposed to potential liability, litigation, governmental inquiries, investigations or regulatory enforcement actions; and we could be subject to payment of fines or other penalties, legal claims by our suppliers, customers or employees and significant remediation costs.
The costs and operational consequences of responding to the above items and implementing remediation measures could be significant and could adversely impact our results of operations and cash flows.
Our inability to protect our trademarks and any other proprietary rights may have a significant, negative impact on our business.
We consider our trademarks to be of significant importance in our business. Although we devote resources to the prosecution, protection and enforcement of our trademarks, we cannot assure you that the actions we have taken or will take in the future will be adequate to prevent infringement of our trademarks and proprietary rights by others or prevent others from seeking to block sales of our products as an alleged infringement of their trademarks and proprietary rights. There can be no assurance that future litigation will not be necessary to enforce our trademarks or proprietary rights or to defend ourselves against claimed infringement of the rights of others. Any future litigation of this type could result in adverse determinations that could have a material adverse effect on our business, financial condition or results of operations. Our inability to use our trademarks and other proprietary rights could also harm our business and sales through reduced demand for our products and reduced revenues.
The products that we manufacture and distribute could expose us to product liability claims.
Our business exposes us to potential product liability risks in the manufacture and distribution of certain of our products. Although we generally seek to insure against such risks, there can be no assurance that coverage will be adequate or that we will be able to maintain such insurance on acceptable terms. A successful product liability claim in excess of our insurance coverage could have a material adverse effect on us and could prevent us from obtaining adequate product liability insurance in the future on commercially reasonable terms.
We have unresolved litigation which could adversely impact our operating results.
We are a party to litigation alleging that the applicator developed and used by us for certain of our branded topical flea and tick products infringes a patent held by Nite Glow Industries, Inc. and asserting claims for breach of contract and misappropriation of confidential information. On June 27, 2018, a jury returned a verdict in favor of Nite Glow on each of the three claims and awarded damages of approximately $12.6 million, which was reduced to $12.4 million. We filed our notice of appeal, and the plaintiff cross-appealed. On July 14, 2021, the Federal Circuit Court of Appeals concluded that the Company did not infringe plaintiff's patent and determined that the breach of contract claim raised no non-duplicative damages and should be dismissed. The court affirmed the jury's liability verdict on the misappropriation of confidential information claim but ordered a new trial on damages on that single claim limited to the "head start" benefit, if any, generated by the confidential information. The retrial of the “head start” damages issue concluded in March 2024, and the court issued its decision on September 30, 2025 awarding the plaintiff $5.0 million. The judgment was entered on October 17, 2025 in the amount of $7.2 million, including prejudgment interest. We intend to appeal the judgment and believe that we will prevail on the merits as to the head start damages issue. While we believe that the ultimate resolution of this matter will not have a material impact on our consolidated financial statements, the outcome of litigation is inherently uncertain and the final resolution of this matter may result in expense to us in excess of management's expectations.
The adoption of new tax legislation, unanticipated changes in our tax provisions, or exposure to additional tax liabilities could affect our profitability and cash flows.
We are subject to income and other taxes in the United States federal jurisdiction and various local, state and foreign jurisdictions. Our effective tax rate in the future could be adversely affected by changes to our operating structure, changes in the mix of business operations and earnings, changes in tax laws and statutory tax rates, and the discovery of new information in the course of our tax return preparation process. From time to time, tax proposals are introduced or considered by the U.S. Congress or the legislative bodies in local and state jurisdictions that could also affect our tax rate or our tax liabilities. Our tax liabilities are also affected by the amounts we charge for inventory, services, licenses, funding and other items in intercompany transactions. We are subject to ongoing tax audits in various jurisdictions. In connection with these audits (or future audits), tax authorities may disagree with our intercompany charges, inter-company transfer pricing methodology or other matters and assess additional taxes. We regularly assess the likely outcomes of our audits in order to determine the appropriateness of our tax provision. As a result, the ultimate resolution of our tax audits and changes in tax laws or tax rates could materially affect our tax provision, net income and cash flows in future periods.
Risks Relating to our Capital Stock
We do not expect to pay cash dividends in the foreseeable future.
We have never paid any cash dividends on our common stock or Class A common stock and currently do not intend to do so. Provisions of our credit facility and the indentures governing our senior notes restrict our ability to pay cash dividends. Any future determination to pay cash dividends will be at the discretion of our Board of Directors, subject to limitations under applicable law and contractual restrictions, and will depend upon our results of operations, financial condition and other factors deemed relevant by our Board of Directors.
We may issue additional shares of our common stock or Class A common stock that could dilute the value and market price of our stock.
We may decide or be required to issue, including upon the exercise of any outstanding stock options, or in connection with any acquisition made by us, additional shares of our common stock or Class A common stock that could dilute the value of our common stock or Class A common stock and may adversely affect the market price of our common stock or Class A common stock.
Our Chairman and founder, through his holdings of our Class B common stock, exercises effective control of the Company, which may discourage potential acquisitions of our business and could have an adverse effect on the market price of our stock.
Holders of our Class B common stock are entitled to the lesser of ten votes per share or 49% of the total votes cast, and each share of Class B common stock is convertible at any time into one share of our common stock. Holders of our common stock are entitled to one vote for each share owned. Holders of our Class A common stock have no voting rights, except as required by Delaware law.
As of September 27, 2025, William E. Brown, our Chairman and founder, beneficially controlled approximately 56% of the voting power of our capital stock. Accordingly, except to the extent that a class vote of the common stock is required by applicable law or our charter, he can effectively control all matters requiring stockholder approval, including the election of our directors, and can exert substantial control over our management and policies. The disproportionate voting rights of our Class B common stock and Mr. Brown’s substantial holdings of Class B common stock could have an adverse effect on the market price of our common stock and Class A common stock. Also, such disproportionate voting rights and Mr. Brown’s controlling interest may make us a less attractive target for a takeover than we otherwise might be, or render more difficult or discourage a merger proposal, tender offer or proxy contest, even if such actions were favored by our other stockholders, which could thereby deprive holders of common stock or Class A common stock of an opportunity to sell their shares for a “take-over” premium.
We have authorized the issuance of shares of common stock, Class A common stock and preferred stock, which may discourage potential acquisitions of our business and could have an adverse effect on the market price of our common stock and our Class A common stock.
Pursuant to our Fourth Amended and Restated Certificate of Incorporation, the Board of Directors is authorized to issue up to 80,000,000 shares of our common stock, 100,000,000 shares of our nonvoting Class A common stock, 3,000,000 shares of our Class B common stock and up to 1,000,000 additional shares of preferred stock without seeking the approval or consent of our stockholders, unless required by the NASDAQ Global Market. Although the issuance of the additional shares of nonvoting Class A common stock would not dilute the voting rights of the existing stockholders, it would have a dilutive effect on the economic interest of currently outstanding shares of common stock and Class B common stock similar to the dilutive effect of subsequent issuances of ordinary common stock. The issuance of preferred stock could, depending on the rights and privileges designated by the board with respect to any particular series, have a dilutive effect on the voting interests of the common stock and Class B common stock and the economic interests of our common stock, Class A common stock and Class B common stock. In addition, the disproportionate voting rights of our Class B common stock, and the ability of the board to issue stock to persons aligned with current management, may make us a less attractive target for a takeover than we otherwise might be or render more difficult or discourage a merger proposal, tender offer or proxy contest, even if such actions were favored by our common stockholders, which could thereby deprive holders of common stock of an opportunity to sell their shares for a “take-over” premium.
Item 1B. Unresolved Staff Comments
None.
Item 1C. Cybersecurity
Cybersecurity Risk Management and Strategy:
We recognize the importance of assessing, identifying, and managing material risks associated with cybersecurity threats, as such term is defined in Item 106(a) of Regulation S-K. These risks include, among other things, operational risks; intellectual property theft; fraud; extortion; harm to employees, customers or consumers; violation of data privacy or data security laws and other litigation and legal risk; and reputational risks.
We also maintain an incident response plan to coordinate the activities we take to protect against, detect, respond to and remediate cybersecurity incidents, as such term is defined in Item 106(a) of Regulation S-K, as well as to comply with potentially applicable legal obligations and mitigate risk, including reputational damage.
•conducting regular network and endpoint monitoring, vulnerability assessments, and penetration testing to improve our information systems, as such term is defined in Item 106(a) of Regulation S-K;
•running tabletop exercises to simulate a response to a cybersecurity incident and use the findings to improve our processes and technologies;
•regular, mandatory cybersecurity training programs for relevant employees;
•comparing our processes to standards set by the International Organization for Standardization (“ISO”);
•leveraging the ISO information security incident management model to help us identify, protect, detect, respond, and recover when there is an actual or potential cybersecurity incident;
•leveraging third-party threat intelligence services designed to model and research our adversaries;
•closely monitoring emerging data protection laws and implementing changes to our processes designed to comply;
11
•periodically reviewing our consumer facing policies and statements related to cybersecurity;
•conducting regular phishing email simulations for relevant employees and all contractors with access to corporate email systems to enhance awareness and responsiveness to such possible threats;
•through policy, practice and contract (as applicable) requiring employees, as well as third parties who provide services on our behalf, to treat customer information and data with care; and
•carrying information security risk insurance that provides protection against the potential losses arising from a cybersecurity incident.
These approaches vary in maturity across the business and we work to continually improve them.
Our process for identifying and assessing material risks from cybersecurity threats operates alongside our broader overall risk assessment process, covering all company risks. As part of this process appropriate disclosure personnel will collaborate with subject matter specialists, as necessary, to gather insights for identifying and assessing material cybersecurity threat risks, their severity, and potential mitigations.
We describe how risks associated with a potential cybersecurity incident are reasonably likely to materially affect us, including our business, results of operations and financial condition, under the heading “A significant information security or operational technology incident, including a cyberattack or a data breach, could disrupt our operations and adversely impact our operating results, cash flows and reputation,” included as part of our risk factor disclosures at Item 1A of this Annual Report on Form 10-K, which disclosures are incorporated by reference herein.
Cybersecurity Governance:
Cybersecurity is an important part of our risk management processes and an area of increasing focus for our Board and management.
Our cybersecurity risk management and strategy processes, which are discussed in greater detail above, are led by our InfoSec Leadership Team . The executives on this team have collectively over 60 years of prior work experience in the management of information security, developing cybersecurity strategy and implementing effective information and cybersecurity programs. In addition to their work experience, Mr. Madigan has a Master of Business Administration in Information Technology Management and Mr. James has a Master of Science in Information Security and Assurance.
The InfoSec Leadership Team is informed about and monitors the prevention, mitigation, detection, and remediation of cybersecurity incidents through their management of, and participation in, the cybersecurity risk management and strategy processes described above, including the operation of our incident response plan. If a cybersecurity incident is determined to be a material cybersecurity incident, our incident response plan and cybersecurity disclosure controls and procedures define the process to disclose such material cybersecurity incident.
Item 2. Properties
We currently operate 37 manufacturing facilities totaling approximately 6.1 million square feet and 52 sales and distribution facilities totaling approximately 5.7 million square feet. Most sales and distribution centers consist of office and warehouse space, and several large bays for loading and unloading. Each sales and distribution center provides warehouse, distribution, sales and support functions for its geographic area. Our executive offices are located in Walnut Creek, California.
12
In addition to the manufacturing and sales and distribution facilities, the Garden segment leases approximately 239 acres of land in New Jersey and Virginia used in its grass seed and live plant operations and owns approximately 2,402 acres of land in Virginia, North Carolina, Maryland, Ohio, New Jersey and Kentucky used in its live plant operations. The Pet segment leases approximately 60 acres of land in Florida to support its live fish operations.
We continually review the number, location and size of our manufacturing and sales and logistics facilities and expect to make changes over time to optimize our manufacturing and distribution footprints. We lease 15 of our manufacturing facilities and 40 of our sales and logistics facilities. These leases generally expire between fiscal years 2026 and 2034. Substantially all of the leases contain renewal provisions with automatic rent escalation clauses. The facilities we own are subject to major encumbrances under our principal credit facility. In addition to the facilities that are owned, our fixed assets are comprised primarily of machinery and equipment, trucks and warehousing, transportation and computer equipment.
13
Item 3. Legal Proceedings
In 2012, Nite Glow Industries, Inc. and its owner, Marni Markell, ("Nite Glow") filed suit in the U.S. District Court for New Jersey against the Company alleging that the applicator developed and used by the Company for certain of its branded topical flea and tick products infringes a patent held by Nite Glow and asserted related claims for breach of contract and misappropriation of confidential information based on the terms of a Non-Disclosure Agreement. On June 27, 2018, a jury returned a verdict in favor of Nite Glow on each of the three claims and awarded damages of approximately $12.6 million. The court ruled on post-trial motions in early June 2020, reducing the judgment amount to $12.4 million and denying the plaintiff's request for attorneys' fees. The Company filed its notice of appeal and the plaintiffs cross-appealed. On July 14, 2021, the Federal Circuit Court of Appeals issued its decision on the appeal. The Federal Circuit concluded that the Company did not infringe plaintiff's patent and determined that the breach of contract claim raised no non-duplicative damages and should be dismissed. The court affirmed the jury's liability verdict on the misappropriation of confidential information claim but ordered a new trial on damages on that single claim limited to the "head start" benefit, if any, generated by the confidential information. The retrial on the "head start" damages issue concluded in early March 2024. On September 30, 2025, the court issued its decision awarding the plaintiff $5.0 million, and judgment was entered on October 17, 2025 in the amount of $7.2 million, including prejudgment interest. The Company intends to appeal the judgment and believes that it will prevail in the appeal and in any further proceedings as to the head start damages issue. While the Company believes that the ultimate resolution of this matter will not have a material impact on the Company's consolidated financial statements, the outcome of litigation is inherently uncertain and the final resolution of this matter may result in expense to the Company in excess of management's expectations.
From time to time, we are involved in certain legal proceedings in the ordinary course of business. Except as discussed above, we are not currently a party to any other legal proceedings that management believes could have a material effect on our financial position or results of operations.
Item 4. Mine Safety Disclosures
Not applicable.
14
PART II
Item 5. Market for the Registrant’s Common Equity, Related Stockholder Matters and Issuer Purchases of Equity Securities
Our common stock is traded on the NASDAQ Stock Market under the symbol CENT, and our Class A common stock is traded on the NASDAQ Stock Market under the symbol CENTA. Our Class B stock is not listed on any market and generally cannot be transferred unless converted to common stock on a one-for-one basis.
As of November 19, 2025, there were 60 holders of record of our common stock, 367 holders of record of our Class A nonvoting common stock and three holders of record of our Class B stock.
Stock Performance Graph
The following graph compares the percentage change of our cumulative total stockholder return on our Common Stock (“CENT”) for the period from September 26, 2020 to September 27, 2025 with the cumulative total return of the NASDAQ Composite (U.S.) Index and the Dow Jones Non-Durable Household Products Index, a peer group index consisting of approximately 30 manufacturers and distributors of household products.
The comparisons in the graph below are based on historical data and are not indicative of, or intended to forecast, the possible future performance of our Common Stock.

15
Total Return Analysis
| 9/26/2020 | 9/25/2021 | 9/24/2022 | 9/30/2023 | 9/28/2024 | 9/27/2025 | |||||||||||||||||||||||||||||||||
| Central Garden & Pet Company | $ | 100.00 | $ | 123.47 | $ | 99.58 | $ | 116.77 | $ | 123.88 | $ | 112.32 | ||||||||||||||||||||||||||
| NASDAQ Composite | $ | 100.00 | $ | 138.82 | $ | 101.01 | $ | 123.97 | $ | 171.21 | $ | 213.87 | ||||||||||||||||||||||||||
| Dow Jones US Nondurable Household Products | $ | 100.00 | $ | 103.94 | $ | 99.70 | $ | 110.46 | $ | 138.35 | $ | 121.25 | ||||||||||||||||||||||||||
Purchases of Equity Securities by the Issuer and Affiliated Purchasers
The following table sets forth the repurchases of any equity securities during the fourth quarter of the fiscal year ended September 27, 2025 and the dollar amount of authorized share repurchases remaining under our stock repurchase programs.
| Period | Total Number of Shares (or Units) Purchased | Average Price Paid per Share (or Unit) | Total Number of Shares (or Units) Purchased as Part of Publicly Announced Plans or Programs | Maximum Number (or Approximate Dollar Value) of Shares (or Units) that May Yet Be Purchased Under the Plans or Programs (1) (2) | ||||||||||||||||||||||||||||
| June 29, 2025 – August 2, 2025 | 3,924 | (3) | $ | 35.85 | — | $ | 46,474,000 | |||||||||||||||||||||||||
| August 3, 2025 – August 30, 2025 | 1,912 | (3) | $ | 31.22 | — | 46,474,000 | ||||||||||||||||||||||||||
| August 31, 2025 – September 27, 2025 | 702 | (3) | $ | 32.55 | — | 46,474,000 | ||||||||||||||||||||||||||
| Total | 6,538 | $ | 34.14 | — | $ | 46,474,000 | (2) | |||||||||||||||||||||||||
(1)In December 2024, our Board of Directors authorized a $100 million increase in our share repurchase program (the "2024 Repurchase Authorization”). The 2024 Repurchase Authorization has no fixed expiration date and expires when the amount authorized has been used or the Board withdraws its authorization. The repurchase of shares may be limited by certain financial covenants in our credit facility that restrict our ability to repurchase our stock. As of September 27, 2025, we had $46.5 million of authorization remaining under our 2024 Repurchase Authorization.
(2)In February 2019, our Board of Directors authorized us to make supplemental stock purchases to minimize dilution resulting from issuances under our equity compensation plans (the “Equity Dilution Authorization”). In addition to our regular share repurchase program, we are permitted to purchase annually a number of shares equal to the number of shares of restricted stock and stock options granted in the prior fiscal year, to the extent not already repurchased, and the current fiscal year. The Equity Dilution Authorization has no fixed expiration date and expires when the Board withdraws its authorization. There were no shares remaining under our Equity Dilution Authorization as of September 27, 2025.
(3)Shares purchased during the period indicated represent withholding of a portion of shares to cover taxes in connection with the vesting of restricted stock and do not reduce the dollar value of shares that may be purchased under our stock repurchase plan.
16
Item 6. Reserved
Item 7. Management’s Discussion and Analysis of Financial Condition and Results of Operations
The following is management’s discussion of the financial results, liquidity and other key items related to our performance. This discussion should be read in conjunction with our consolidated financial statements and the related notes and other financial information appearing elsewhere in this Form 10-K. This Form 10-K contains forward-looking statements that involve risks and uncertainties. Our actual results may differ materially from those indicated in forward-looking statements. See “Forward-Looking Statements” and “Item 1A – Risk Factors.”
Business Overview
Central Garden & Pet Company is a leading manufacturer and distributor of branded and private label products for the lawn & garden and pet supplies markets in the United States.
In fiscal 2025, our consolidated net sales were $3.1 billion, of which our Pet segment, or Pet, accounted for approximately $1.8 billion and our Garden segment, or Garden, accounted for approximately $1.3 billion. In fiscal 2025, our operating income was $250 million, consisting of income from our Pet segment of $216 million, income from our Garden segment of $142 million and corporate expenses of $108 million.
Fiscal 2025 Financial Highlights
Financial summary:
•Net sales for fiscal 2025 decreased $71.4 million, or 2.2%, to $3.1 billion. Pet net sales decreased $30.8 million, or 1.7%, and Garden net sales decreased $40.6 million, or 3.0%.
•Gross profit for fiscal 2025 increased $53.6 million, or 5.7%, to $997.3 million and gross margin increased 240 basis points in fiscal 2025 to 31.9%, from 29.5% in fiscal 2024. On a non-GAAP basis, gross margin increased 210 basis points in fiscal 2025.
•Our operating income increased $64.7 million, or 34.9%, to $250.0 million in fiscal 2025. On a non-GAAP basis, operating income increased $42.2 million, or 19.0%, in fiscal 2025.
•Net income for fiscal 2025 was $162.8 million, or $2.55 per share on a diluted basis compared to $108.0 million, or $1.62 per share on a diluted basis in fiscal 2024. On a non-GAAP basis, net income in fiscal 2025 was $174.2 million, or $2.73 per share on a diluted basis compared to $142.4 million, or $2.13 per share on a diluted basis in fiscal 2024.
Recent Developments:
Wind-down of U.K. Operations
In March 2025, we decided to wind-down our operations in the United Kingdom, which also served certain European markets, and move to a direct-export model. During fiscal 2025, we incurred approximately $10.0 million of one-time closure costs, including $5.6 million in cost of goods sold and $4.4 million in selling, general and administrative expense. The amounts were primarily related to the liquidation of inventory and receivables, severance and legal costs.
Facility Closures
During fiscal 2025, we began the consolidation of two legacy distribution facilities in Ontario, California and Salt Lake City, Utah into a new modern facility in Salt Lake City, Utah, reflecting our ongoing network optimization initiative to achieve a simpler, more efficient distribution network. As a result, we recognized $5.0 million in selling, general and administrative expense, composed primarily of charges for lease and severance costs.
Fiscal 2025 Stock Repurchases
During fiscal 2025, we repurchased 3.2 million shares of our non-voting common stock (CENTA) and 1.4 million shares of our voting common stock (CENT) on the open market at an aggregate cost of $148.4 million. As of September 27, 2025, we had $46.5 million remaining under our 2024 Repurchase Authorization.
Tax Reform
On July 4, 2025, H.R. 1, commonly known as the “One Big Beautiful Bill Act” (the “OBBBA”), was enacted into law. The OBBBA contains numerous federal tax provisions including modifications to the capitalization of research and development expenses, limitations on deductions for interest expense, and accelerated fixed asset depreciation. Because the OBBBA was enacted during fiscal 2025, we have
17
reflected the impact of the provisions that were effective during the year in our income tax provision. The impact of the OBBBA on our fiscal 2025 consolidated financial statements was not material. We will continue to monitor the OBBBA and any related regulatory or interpretive guidance and will update our accounting in future periods as required.
Results of Operations (GAAP)
The following table sets forth, for the periods indicated, the relative percentages that certain income and expense items bear to net sales:
| Fiscal Year Ended | ||||||||||||||||||||
| September 27, 2025 | September 28, 2024 | September 30, 2023 | ||||||||||||||||||
| Net sales | 100.0 | % | 100.0 | % | 100.0 | % | ||||||||||||||
| Cost of goods sold and occupancy | 68.1 | 70.5 | 71.4 | |||||||||||||||||
| Gross profit | 31.9 | 29.5 | 28.6 | |||||||||||||||||
| Selling, general and administrative | 23.9 | 23.7 | 22.2 | |||||||||||||||||
| Operating income | 8.0 | 5.8 | 6.4 | |||||||||||||||||
| Interest expense, net | (1.0) | (1.2) | (1.5) | |||||||||||||||||
| Other expense, net | — | (0.2) | — | |||||||||||||||||
| Income taxes | 1.7 | 1.0 | 1.1 | |||||||||||||||||
| Net income | 5.2 | % | 3.4 | % | 3.8 | % | ||||||||||||||
Fiscal 2025 Compared to Fiscal 2024
Net Sales
Net sales for fiscal 2025 decreased $71.4 million, or 2.2%, to $3,129.1 million from $3,200.5 million in fiscal 2024. Our branded product sales, which include products we produce under Central brand names and products we produce under third-party brands, decreased $30.6 million, and sales of other manufacturers’ products decreased $40.8 million. In fiscal 2025, sales of branded products represented approximately 79% of our net sales, compared to 78% in fiscal 2024, and sales of other manufacturers' products represented 21% of our net sales.
The following table indicates each class of similar products which represented approximately 10% or more of our consolidated net sales in the fiscal years presented:
| Category | 2025 | 2024 | 2023 | |||||||||||||||||
| (in millions) | ||||||||||||||||||||
| Other garden products | $ | 808.2 | $ | 832.9 | $ | 832.2 | ||||||||||||||
| Other pet products | 602.6 | 635.0 | 699.4 | |||||||||||||||||
| Other manufacturers' products | 664.7 | 705.6 | 734.9 | |||||||||||||||||
| Dog & cat products | 592.8 | 600.6 | 568.6 | |||||||||||||||||
| Wild bird | 460.8 | 426.4 | 475.0 | |||||||||||||||||
| Total | $ | 3,129.1 | $ | 3,200.5 | $ | 3,310.1 | ||||||||||||||
Pet net sales decreased $30.8 million, or 1.7%, to $1,802.0 million in fiscal 2025 from $1,832.8 million in fiscal 2024. The decline in Pet net sales was due primarily to lower sales of durable items impacting our outdoor cushions, pet beds and aquatics businesses. These declines were partially offset by increased sales in our animal health business. Pet branded sales decreased $36.0 million, and sales of other manufacturers' products increased $5.2 million.
Garden net sales decreased $40.6 million, or 3.0%, to $1,327.1 million in fiscal 2025 from $1,367.7 million in fiscal 2024. The decline in Garden net sales was due primarily to decreased sales of third-party products resulting from the loss of distribution of two product lines and our planned exit of the pottery business. Increased sales of wild bird feed and private label products were partially offset by decreased sales in both our controls and live plants businesses due to cool and wet weather during the early part of the garden season. Garden branded sales increased $5.4 million, and sales of other manufacturers' products decreased $46.0 million.
18
Gross Profit
Gross profit in fiscal 2025 increased $53.6 million, or 5.7%, to $997.3 million from $943.7 million in fiscal 2024. Gross margin improved 240 basis points to 31.9% in fiscal 2025 from 29.5% in fiscal 2024. Pet and Garden both contributed to the increase in gross profit and gross margin.
Gross profit in Pet, in both fiscal 2024 and 2025, and Garden, in fiscal 2024, was impacted by facility closure projects under our Cost and Simplicity agenda. On a non-GAAP basis, excluding approximately $6 million in charges associated with the facility closures in fiscal 2025 and approximately $16 million in fiscal 2024, gross profit increased $42.8 million and gross margin improved 210 basis points to 32.1% in fiscal 2025 from 30.0% in fiscal 2024.
The increase in gross profit and gross margin in Pet was due primarily to efficiency gains and structural improvements resulting from productivity initiatives under our Cost and Simplicity agenda and some commodity price deflation. These improvements more than offset the impact of tariffs.
The increase in gross profit and gross margin in Garden was due primarily to improvements in our Live Goods business in fiscal 2025, from cost reduction initiatives under our Cost and Simplicity agenda and the adverse impact in fiscal 2024 from the write-down of the value of our grass seed inventory in fiscal 2024 of approximately $20 million, due to a significant decrease in the market prices of grass seed and an industry-wide over supply of grass seed.
Selling, General and Administrative
Selling, general and administrative expenses decreased $11.0 million, or 1.5%, from $758.3 million in fiscal 2024 to $747.3 million in fiscal 2025. As a percentage of net sales, selling, general and administrative expenses increased from 23.7% in fiscal 2024 to 23.9% in fiscal 2025. The decrease in selling, general and administrative expense was due to $21.1 million in additional costs incurred in the prior year related to the closure of facilities in both the Pet and Garden segments and intangible asset impairments as compared to $9.4 million in additional costs in fiscal 2025 related to facility closures. Excluding these additional costs in both fiscal 2025 and 2024, non-GAAP selling, general and administrative expense increased $0.6 million to $737.9 million from $737.3 million in fiscal 2024. Decreased selling, general and administrative expenses in both Pet and Garden were partially offset by increased expense at corporate.
Selling and delivery expense increased $6.1 million, or 1.8%, to $345.9 million for fiscal 2025 from $339.9 million for fiscal 2024. An increase in the Pet segment, related to increased marketing expense, including promotional and digital marketing spend, and at corporate, related to marketing investment expense, was partially offset by a decrease in the Garden segment due primarily to lower discretionary marketing spend and lower delivery expense.
Warehouse and administrative expense decreased $17.1 million, or 4.1%, to $401.4 million for fiscal 2025 from $418.5 million for fiscal 2024. Decreased expense in the Pet segment, due primarily to intangible asset impairments in fiscal 2024, and in the Garden segment, related to lower facility closure costs in fiscal 2025 as compared to fiscal 2024, were partially offset by increased corporate expense.
Corporate expense increased $8.1 million due primarily to increased variable compensation expense, increased marketing investment and the nonrecurrence of a gain from a litigation settlement in fiscal 2024. Corporate expenses are included within administrative expense and relate to the costs of unallocated executive, administrative, finance, legal, human resources, and information technology functions.
Operating Income
Operating income improved $64.7 million, or 34.9%, to $250.0 million in fiscal 2025. Operating income improved due to a $53.6 million increase in gross profit, related to a 240-basis point increase in gross margin, and a $11.1 million decrease in selling, general and administrative expenses. These improvements were partially offset by a $71.4 million decrease in net sales. Our operating margin improved to 8.0% in fiscal 2025 from 5.8% in fiscal 2024. Excluding the impact of facility closures in fiscal 2025 and 2024 and intangible asset impairments in fiscal 2024, non-GAAP operating income improved $42.2 million and our non-GAAP operating margin improved to 8.5% in fiscal 2025 from 7.0% in fiscal 2024. These improvements were due primarily to efficiency gains and cost reductions from earlier productivity initiatives under our Cost and Simplicity agenda and the write-down of the value of our grass seed inventory in fiscal 2024.
Pet operating income increased $12.3 million, or 6.0%, to $215.7 million in fiscal 2025 from $203.4 million in fiscal 2024, due to an improved gross margin and decreased selling, general and administrative expenses partially offset by lower net sales. Pet operating margin increased from 11.1% in fiscal 2024 to 12.0% in fiscal 2025. On a non-GAAP basis, Pet operating income increased $1.9 million in fiscal 2025 as compared to fiscal 2024 and operating margin improved to 12.5% in fiscal 2025 from 12.2% in fiscal 2024.
Garden operating income improved $60.5 million, or 73.9%, to $142.4 million in fiscal 2025 from $81.9 million in fiscal 2024, due to a $45.3 million increase in gross profit and a $15.2 million decrease in selling, general and administrative expense partially offset by a $40.6 million decrease in net sales. Garden operating margin improved to 10.7% in fiscal 2025 from 6.0% in fiscal 2024. On a non-GAAP basis, excluding the charges in fiscal 2025 and 2024 related to facility closures, Garden operating income improved $45.2 million and non-GAAP operating margin improved to 11.1% in fiscal 2025 from 7.5% in fiscal 2024.
19
Corporate expenses increased $8.1 million due primarily to increased variable compensation expense, increased marketing investment and the nonrecurrence of a gain from a litigation settlement in fiscal 2024.
Net Interest Expense
Net interest expense decreased $5.1 million, or 13.4%, from $37.9 million in fiscal 2024 to $32.8 million in fiscal 2025. The decrease in net interest expense was due to increased interest income resulting from higher cash balances during fiscal 2025.
Debt outstanding on September 27, 2025 and September 28, 2024 was $1.2 billion. Our average borrowing rate was 4.5% in both fiscal 2025 and fiscal 2024.
Other Income (Expense)
Other income (expense) is comprised of income or loss from investments accounted for under the equity method of accounting and foreign currency exchange gains and losses. Other income (expense) was an expense of $0.5 million in fiscal 2025 compared to $5.1 million in fiscal 2024. The decrease in expense was due primarily to a $7.5 million non-cash impairment in fiscal 2024 for two private company investments.
Income Tax
Our effective income tax rate was 24.4% for fiscal 2025 compared to 23.2% for fiscal 2024. The increase in our effective income tax rate was due primarily to the non-deductibility for tax purposes of losses incurred in connection with the wind-down of our U.K. operations.
Net Income and Earnings Per Share
Our net income for fiscal 2025 was $162.8 million, or $2.55 per diluted share, compared to $108.0 million, or $1.62 per diluted share, for fiscal 2024. On a non-GAAP basis, net income in fiscal 2025 was $174.2 million, or $2.73 per diluted share, compared to $142.4 million, or $2.13 per diluted share, for fiscal 2024.
Fiscal 2024 Compared to Fiscal 2023
For a discussion of our results of operations in fiscal 2024 compared to fiscal 2023, please see Item 7 of our Annual Report on Form 10-K for the fiscal year ended September 28, 2024 filed with the SEC.
Use of Non-GAAP Financial Measures
We report our financial results in accordance with GAAP. However, to supplement the financial results prepared in accordance with GAAP, we use non-GAAP financial measures including non-GAAP net income and diluted net income per share, non-GAAP operating income, non-GAAP gross profit and gross margin, non-GAAP selling, general and administrative expense and adjusted EBITDA. Management uses these non-GAAP financial measures that exclude the impact of specific items (described below) in making financial, operating and planning decisions and in evaluating our performance. Management believes that these non-GAAP financial measures may be useful to investors in their assessment of our ongoing operating performance and provide additional meaningful comparisons between current results and results in prior operating periods. While management believes that non-GAAP measures are useful supplemental information, such adjusted results are not intended to replace our GAAP financial results and should be read in conjunction with those GAAP results.
Adjusted EBITDA is defined by us as income before income tax, net other expense, net interest expense, depreciation and amortization and stock-based compensation expense (or operating income plus depreciation and amortization expense and stock-based compensation expense). Adjusted EBITDA further excludes one-time charges related to facility closures, exits of businesses, intangible and investment impairments and gains from litigation. We present adjusted EBITDA because we believe that adjusted EBITDA is a useful supplemental measure in evaluating the cash flows and performance of our business and provides greater transparency into our results of operations. Adjusted EBITDA is used by our management to perform such evaluations. Adjusted EBITDA should not be considered in isolation or as a substitute for cash flow from operations, income from operations or other income statement measures prepared in accordance with GAAP. We believe that adjusted EBITDA is frequently used by investors, securities analysts and other interested parties in their evaluation of companies, many of which present adjusted EBITDA when reporting their results. Other companies may calculate adjusted EBITDA differently and it may not be comparable.
The reconciliations of these non-GAAP measures to the most directly comparable financial measures calculated and presented in accordance with GAAP are shown in the tables below.
Non-GAAP financial measures reflect adjustments based on the following items:
•Facility closures and business exit: we have excluded charges related to the closure of distribution and manufacturing facilities and our decision to exit the pottery business as they represent infrequent transactions that impact the comparability
20
between operating periods. We believe these exclusions supplement the GAAP information with a measure that may be useful to investors in assessing the sustainability of our operating performance.
•Asset impairment charges: we exclude the impact of asset impairments on intangible assets and investments as such non-cash amounts are inconsistent in amount and frequency. We believe that the adjustment of these charges supplements the GAAP information with a measure that can be used to assess the performance of our ongoing operations.
•Gain from litigation settlement: we exclude the gain from a litigation settlement as it is a one-time occurrence. We believe that the exclusion of this gain supplements the GAAP information with a measure that can be used to assess the performance of our ongoing operations.
•Tax impact: adjustment represents the impact of the tax effect of the pre-tax non-GAAP adjustments excluded from non-GAAP net income. The tax impact of the non-GAAP adjustments is calculated based on the consolidated effective tax rate on a GAAP basis, applied to the non-GAAP adjustments.
From time to time in the future, there may be other items that we may exclude if we believe that doing so is consistent with the goal of providing useful information to investors and management.
The non-GAAP adjustments made reflect the following:
Facility closures and business exits
(1)During fiscal 2025, we recognized incremental expense of $5.0 million in our Garden segment in the consolidated statement of operations related to closing a distribution facility in Ontario, California and executing the consolidation of our Western distribution network. Additionally, the charge includes costs related to the closure of a live goods facility.
(2)During fiscal 2025, we recognized incremental expense of $10.0 million in our Pet segment in the consolidated statement of operations related to our decision to wind-down our operations in the U.K. and the related facility as we move to a direct-export model.
(3)During fiscal 2024, we recognized incremental expense of $20.3 million in our Garden segment in the consolidated statement of operations, from the closure of a manufacturing facility in California, the consolidation of our Southeast distribution network, the decision to exit the pottery business, the closure of a live goods distribution facility in Delaware, the relocation of our grass seed research facility related, and facility closures announced in fiscal 2023.
(4)During fiscal 2024, we recognized incremental expense of $7.5 million in our Pet segment in the consolidated statement of operations, from the closure of manufacturing facilities in California and Arizona.
Intangible Impairments
(5)During fiscal 2024, we recognized a non-cash impairment charge in our Pet segment of $12.8 million related to the impairment of intangible assets due primarily to changing market conditions resulting from the decline in demand for durable products and increased international competition.
Gain from litigation and investment impairment
(6)In fiscal 2024, within corporate, we received $3.2 million in settlement of litigation, the gain of which is included in selling, general and administrative expense. Additionally, we recognized a $7.5 million non-cash impairment charge for two related private company investments that is included within Other income (expense) in the consolidated statement of operations.
21
| Net Income and Diluted Net Income Per Share | ||||||||||||||
| GAAP to Non-GAAP Reconciliation | Fiscal Year Ended | |||||||||||||
| September 27, 2025 | September 28, 2024 | |||||||||||||
| (in thousands, except per share amount) | ||||||||||||||
| GAAP net income attributable to Central Garden & Pet Company | $ | 162,843 | $ | 107,983 | ||||||||||
| Facility closures & business exits | (1)(2)(3)(4) | 15,005 | 27,842 | |||||||||||
| Intangible impairments | (5) | — | 12,790 | |||||||||||
| Litigation settlement | (6) | — | (3,200) | |||||||||||
| Investment impairment | (6) | — | 7,461 | |||||||||||
| Tax effect of adjustments | (3,654) | (10,437) | ||||||||||||
| Non-GAAP net income attributable to Central Garden & Pet Company | $ | 174,194 | $ | 142,439 | ||||||||||
| GAAP diluted net income per share | $ | 2.55 | $ | 1.62 | ||||||||||
| Non-GAAP diluted net income per share | $ | 2.73 | $ | 2.13 | ||||||||||
| Shares used in GAAP and non-GAAP diluted net income per share calculation | 63,815 | 66,860 | ||||||||||||
| Operating Income | ||||||||||||||||||||||||||||||||||||||
| GAAP to Non-GAAP Reconciliation | Fiscal Year Ended September 27, 2025 | Fiscal Year Ended September 28, 2024 | ||||||||||||||||||||||||||||||||||||
| GAAP | Adjustments(1)(2) | Non-GAAP | GAAP | Adjustments(3)(4)(5)(6) | Non-GAAP | |||||||||||||||||||||||||||||||||
| (in thousands) | (in thousands) | |||||||||||||||||||||||||||||||||||||
| Net sales | $ | 3,129,064 | $ | — | $ | 3,129,064 | $ | 3,200,460 | $ | — | $ | 3,200,460 | ||||||||||||||||||||||||||
| Cost of goods sold and occupancy | 2,131,728 | 5,582 | 2,126,146 | 2,256,725 | 16,349 | $ | 2,240,376 | |||||||||||||||||||||||||||||||
| Gross profit | $ | 997,336 | $ | (5,582) | $ | 1,002,918 | $ | 943,735 | $ | (16,349) | $ | 960,084 | ||||||||||||||||||||||||||
| Selling, general and administrative expenses | 747,294 | 9,423 | 737,871 | 758,348 | 21,083 | 737,265 | ||||||||||||||||||||||||||||||||
| Income from operations | $ | 250,042 | $ | (15,005) | $ | 265,047 | $ | 185,387 | $ | (37,432) | $ | 222,819 | ||||||||||||||||||||||||||
| Gross margin | 31.9 | % | 32.1% | 29.5% | 30.0% | |||||||||||||||||||||||||||||||||
| Operating margin | 8.0 | % | 8.5% | 5.8% | 7.0% | |||||||||||||||||||||||||||||||||
| Pet Segment Operating Income | ||||||||||||||
| GAAP to Non-GAAP Reconciliation | Fiscal Year Ended | |||||||||||||
| September 27, 2025 | September 28, 2024 | |||||||||||||
| (in thousands) | ||||||||||||||
| GAAP operating income | $ | 215,688 | $ | 203,425 | ||||||||||
| Facility closures | (2)(4) | 10,018 | 7,549 | |||||||||||
| Intangible impairments | (5) | — | 12,790 | |||||||||||
| Non-GAAP operating income | $ | 225,706 | $ | 223,764 | ||||||||||
| GAAP operating margin | 12.0% | 11.1% | ||||||||||||
| Non-GAAP operating margin | 12.5% | 12.2% | ||||||||||||
22
| Garden Segment Operating Income | ||||||||||||||
| GAAP to Non-GAAP Reconciliation | Fiscal Year Ended | |||||||||||||
| September 27, 2025 | September 28, 2024 | |||||||||||||
| (in thousands) | ||||||||||||||
| GAAP operating income | $ | 142,402 | $ | 81,893 | ||||||||||
| Facility closures | (1)(3) | 4,987 | 20,293 | |||||||||||
| Non-GAAP operating income | $ | 147,389 | $ | 102,186 | ||||||||||
| GAAP operating margin | 10.7% | 6.0% | ||||||||||||
| Non-GAAP operating margin | 11.1% | 7.5% | ||||||||||||
23
| Adjusted EBITDA | ||||||||||||||||||||||||||
| GAAP to Non-GAAP Reconciliation | Fiscal Year Ended September 27, 2025 | |||||||||||||||||||||||||
| Pet | Garden | Corp | Total | |||||||||||||||||||||||
| (in thousands) | ||||||||||||||||||||||||||
| Net income attributable to Central Garden & Pet | $ | — | $ | — | $ | — | $ | 162,843 | ||||||||||||||||||
| Interest expense, net | — | — | — | 32,812 | ||||||||||||||||||||||
| Other expense | — | — | — | 480 | ||||||||||||||||||||||
| Income tax expense | — | — | — | 52,787 | ||||||||||||||||||||||
| Net income attributable to noncontrolling interest | — | — | — | 1,120 | ||||||||||||||||||||||
| Income (loss) from operations | 215,688 | 142,402 | (108,048) | 250,042 | ||||||||||||||||||||||
| Depreciation & amortization | 39,916 | 42,301 | 2,677 | 84,894 | ||||||||||||||||||||||
| Noncash stock-based compensation | — | — | 21,060 | 21,060 | ||||||||||||||||||||||
| Non-GAAP adjustments | (1)(2) | 10,018 | 4,987 | — | 15,005 | |||||||||||||||||||||
| Adjusted EBITDA | $ | 265,622 | $ | 189,690 | $ | (84,311) | $ | 371,001 | ||||||||||||||||||
| Adjusted EBITDA | ||||||||||||||||||||||||||
| GAAP to Non-GAAP Reconciliation | Fiscal Year Ended September 28, 2024 | |||||||||||||||||||||||||
| Pet | Garden | Corp | Total | |||||||||||||||||||||||
| (in thousands) | ||||||||||||||||||||||||||
| Net income attributable to Central Garden & Pet | $ | — | $ | — | $ | — | $ | 107,983 | ||||||||||||||||||
| Interest expense, net | — | — | — | 37,872 | ||||||||||||||||||||||
| Other expense | — | — | — | 5,090 | ||||||||||||||||||||||
| Income tax expense | — | — | — | 33,112 | ||||||||||||||||||||||
| Net income attributable to noncontrolling interest | — | — | — | 1,330 | ||||||||||||||||||||||
| Income (loss) from operations | 203,425 | 81,893 | (99,931) | 185,387 | ||||||||||||||||||||||
| Depreciation & amortization | 43,642 | 44,403 | 2,762 | 90,807 | ||||||||||||||||||||||
| Noncash stock-based compensation | — | — | 20,583 | 20,583 | ||||||||||||||||||||||
| Non-GAAP adjustments | (3)(4)(5)(6) | 20,339 | 20,293 | (3,200) | 37,432 | |||||||||||||||||||||
| Adjusted EBITDA | $ | 267,406 | $ | 146,589 | $ | (79,786) | $ | 334,209 | ||||||||||||||||||
Inflation
Our revenues and margins are dependent on various economic factors, including fluctuating rates of inflation on various input costs (e.g., commodities and energy), interest rates, currencies and consumer attitudes toward discretionary spending. Inflation moderated in fiscal 2024 and into the first half of fiscal 2025 before increasing in the second half of fiscal 2025 due primarily to the increasing impact of tariffs. We have benefited from lower cost inventory and significant productivity gains resulting in improved margins. However, the continued imposition of tariffs and a global trade war could result in higher inflation in fiscal 2026.
In fiscal year 2021 through 2023, our operating results were adversely impacted by high input costs due to inflation, particularly relating to prices for grain and seed, fuel and the ingredients used in our garden controls and fertilizer business as well as heightened import costs such as shipping container costs and tariffs.
Weather and Seasonality
Our sales of lawn and garden products are influenced by weather and climate conditions in the different markets we serve. Our Garden segment’s business is highly seasonal. In fiscal 2025, approximately 64% of our Garden segment’s net sales and 57% of our total net sales occurred during our second and third fiscal quarters. Substantially all of the Garden segment’s operating income is typically generated in this period.
24
Liquidity and Capital Resources
We have financed our growth through a combination of internally generated funds, bank borrowings, supplier credit, and sales of equity and debt securities to the public.
Our business is seasonal and our working capital requirements and capital resources track closely to this seasonal pattern. Generally, during the first fiscal quarter, accounts receivable reach their lowest level while inventory, accounts payable and short-term borrowings begin to increase. During the second fiscal quarter, accounts receivable, accounts payable and short-term borrowings increase, reflecting the build-up of inventory and related payables in anticipation of the peak lawn and garden selling season. During the third fiscal quarter, inventory levels remain relatively constant while accounts receivable peak and short-term borrowings start to decline as cash collections are received during the peak selling season. During the fourth fiscal quarter, inventory levels are at their lowest, and accounts receivable and payables are substantially reduced through conversion of receivables to cash.
We service two broad markets: pet supplies and lawn and garden supplies. Our pet supplies businesses involve products that have a year-round selling cycle with a slight degree of seasonality. As a result, it is not necessary to maintain large quantities of inventory to meet peak demands. Our lawn and garden businesses are highly seasonal with approximately 64% of our Garden segment’s net sales occurring during the second and third fiscal quarters. This seasonality requires the shipment of large quantities of product well ahead of the peak consumer buying periods. To encourage retailers and distributors to stock large quantities of inventory, industry practice has been for manufacturers to give extended credit terms and/or promotional discounts.
Operating Activities
Net cash provided by operating activities decreased $62.4 million, from $394.9 million in fiscal 2024 to $332.5 million in fiscal 2025. The decrease in cash provided was due primarily to changes in our working capital accounts, due to decreases in inventory and accrued expenses, partially offset by cash provided by the long-term obligations in the current year as compared to cash used for other long-term obligations in the prior year.
Investing Activities
Net cash used in investing activities decreased $60.3 million from $105.2 million in fiscal 2024 to $44.9 million in fiscal 2025. The decrease in cash used in investing activities was due primarily to our acquisition of TDBBS, LLC in fiscal 2024.
Financing Activities
Net cash used in financing activities increased $131.2 million from $25.4 million in fiscal 2024 to $156.6 million in fiscal 2025. The increase in cash used in financing activities during the current year was due primarily to higher stock repurchases in fiscal 2025 compared to fiscal 2024.
We expect that our principal sources of funds will be cash generated from our operations, proceeds from our debt and equity offerings, and, if necessary, borrowings under our $600 million asset backed loan facility. See Note11 - Long-Term Debt, for more information about our debt. Based on our anticipated cash needs, availability under our asset backed loan facility and the scheduled maturity of our debt, we believe that our sources of liquidity should be adequate to meet our working capital, capital spending and other cash needs for at least the next 12 months and beyond. However, we cannot assure you that these sources will continue to provide us with sufficient liquidity and, should we require it, that we will be able to obtain financing on terms satisfactory to us, or at all.
We anticipate that our capital expenditures, which are related primarily to replacements and expansion of and upgrades to plant and equipment and also investment in our continued implementation of a scalable enterprise-wide information technology platform, will be approximately $50 to 60 million over the next 12 months.
As part of our growth strategy, we have acquired a large number of businesses in the past, and we anticipate that we will continue to evaluate potential acquisition candidates in the future. If one or more potential acquisition opportunities, including those that would be material, become available in the near future, we may require additional external capital. In addition, such acquisitions would subject us to the general risks associated with acquiring companies, particularly if the acquisitions are relatively large.
Stock Repurchases
During fiscal 2025, we repurchased approximately 3.2 million shares of our non-voting common stock (CENTA) and approximately 1.4 million shares of our voting common stock (CENT) on the open market at an aggregate cost of approximately $148.4 million. During fiscal 2024, we repurchased approximately 0.3 million shares of our non-voting common stock (CENTA) and approximately 3 thousand shares of our voting common stock (CENT) on the open market at an aggregate cost of approximately $10.8 million.
In August 2019, our Board of Directors authorized a $100 million share repurchase program, in part, to minimize the dilutive impact of our stock-based equity compensation programs over time, which authorization was fully utilized in the third quarter of fiscal 2025.
In December 2024, our Board of Directors authorized a $100 million increase in the share repurchase program (the "2024 Repurchase Authorization"). The 2024 Repurchase Authorization has no fixed expiration date and expires when the amount authorized has been used or
25
the Board withdraws its authorization. As of September 27, 2025, the Company had $46.5 million remaining under its 2024 Repurchase Authorization.
In February 2019, the Board of Directors authorized us to make supplemental purchases to minimize dilution resulting from issuances under our equity compensation plans (the "Equity Dilution Authorization"). In addition to our regular share repurchase program, we are permitted to purchase annually a number of shares equal to the number of shares of restricted stock or stock options granted in the prior fiscal year, to the extent not already repurchased, and the current fiscal year. The Equity Dilution Authorization has no fixed expiration date and expires when the Board withdraws its authorization.
Total Debt
At September 27, 2025, our total debt outstanding was $1,191.7 million versus $1,190.0 million at September 28, 2024.
Senior Notes
$400 million 4.125% Senior Notes due 2031
In April 2021, we issued $400 million aggregate principal amount of 4.125% senior notes due April 2031 (the "2031 Notes"). We used a portion of the net proceeds from the offering to repay all outstanding borrowings under our Credit Facility, with the remainder used for general corporate purposes.
We incurred approximately $6 million of debt issuance costs in conjunction with this issuance, which included underwriter fees and legal, accounting and rating agency expenses. The debt issuance costs are being amortized over the term of the 2031 Notes.
The 2031 Notes require semi-annual interest payments on April 30 and October 30. The 2031 Notes are unconditionally guaranteed on a senior basis by each of our existing and future domestic restricted subsidiaries which are borrowers under or guarantors of our Credit Facility. The 2031 Notes were issued in a private placement under Rule 144A and will not be registered under the Securities Act of 1933.
We may redeem some or all of the 2031 Notes at any time, at our option, prior to April 30, 2026, at the principal amount plus a "make whole" premium. We may redeem some or all of the 2031 Notes at our option, at any time on or after April 30, 2026 for 102.063%, on or after April 30, 2027 for 101.375%, on or after April 30, 2028 for 100.688% and on or after April 30, 2029 for 100.0%, plus accrued and unpaid interest.
The holders of the 2031 Notes have the right to require us to repurchase all or a portion of the 2031 Notes at a purchase price equal to 101% of the principal amount of the notes repurchased, plus accrued and unpaid interest, upon the occurrence of a change of control.
The 2031 Notes contain customary high yield covenants, including covenants limiting debt incurrence and restricted payments, subject to certain baskets and exceptions. We were in compliance with all financial covenants as of September 27, 2025.
$500 million 4.125% Senior Notes due 2030
In October 2020, we issued $500 million aggregate principal amount of 4.125% senior notes due October 2030 (the "2030 Notes"). We used a portion of the net proceeds to redeem all of our outstanding 6.125% senior notes due November 2023 (the "2023 Notes") at a redemption price of 101.531% plus accrued and unpaid interest, and to pay related fees and expenses, with the remainder used for general corporate purposes.
We incurred approximately $8.0 million of debt issuance costs associated with this transaction, which included underwriter fees and legal, accounting and rating agency expenses. The debt issuance costs are being amortized over the term of the 2030 Notes.
The 2030 Notes require semiannual interest payments on October 15 and April 15. The 2030 Notes are unconditionally guaranteed on a senior basis by each of our existing and future domestic restricted subsidiaries which are borrowers under or guarantors of our Credit Facility.
We may redeem some or all of the 2030 Notes, at our option, in whole or in part, at any time on or after October 15, 2025 for 102.063%, on or after October 15, 2026 for 101.375%, on or after October 15, 2027 for 100.688% and on or after October 15, 2028 for 100.0%, plus accrued and unpaid interest.
The holders of the 2030 Notes have the right to require us to repurchase all or a portion of the 2030 Notes at a purchase price equal to 101.0% of the principal amount of the notes repurchased, plus accrued and unpaid interest upon the occurrence of a change of control.
The 2030 Notes contain customary high yield covenants, including covenants limiting debt incurrence and restricted payments, subject to certain baskets and exceptions. We were in compliance with all financial covenants as of September 27, 2025.
$300 Million 5.125% Senior Notes due 2028
In December 2017, we issued $300 million aggregate principal amount of 5.125% senior notes due February 2028 (the "2028 Notes"). We used the net proceeds from the offering to finance acquisitions and for general corporate purposes.
26
We incurred approximately $4.8 million of debt issuance costs in conjunction with this transaction, which included underwriter fees and legal, accounting and rating agency expenses. The debt issuance costs are being amortized over the term of the 2028 Notes.
The 2028 Notes require semiannual interest payments on February 1 and August 1. The 2028 Notes are unconditionally guaranteed on a senior basis by our existing and future domestic restricted subsidiaries who are borrowers under or guarantors of our Credit Facility.
We may redeem some or all of the 2028 Notes at our option, through December 31, 2025 for 101.854% and on or after January 1, 2026 for 100.0%, plus accrued and unpaid interest.
The holders of the 2028 Notes have the right to require us to repurchase all or a portion of the 2028 Notes at a purchase price equal to 101.0% of the principal amount of the notes repurchased, plus accrued and unpaid interest upon the occurrence of a change of control.
The 2028 Notes contain customary high-yield covenants, including covenants limiting debt incurrence and restricted payments, subject to certain baskets and exceptions. We were in compliance with all financial covenants as of September 27, 2025.
Asset-Based Loan Facility
On November 7, 2025, we entered into a Fourth Amended and Restated Credit Agreement (the “Credit Agreement”). The Credit Agreement provides for a $600 million principal amount senior secured asset-based revolving credit facility, with up to an additional $400 million principal amount available, as defined, if we exercise the uncommitted accordion feature set forth therein (collectively, the “Credit Facility”). The Credit Facility matures on November 7, 2030. We may borrow, repay and reborrow amounts under the Credit Facility until its maturity date, at which time all amounts outstanding under the Credit Facility must be repaid in full.
The Credit Facility is subject to a borrowing base that is calculated using a formula based upon eligible receivables and inventory, and at our election, eligible real property, minus certain reserves. Proceeds of the Credit Facility may be used for general corporate purposes. The Credit Facility includes a $50 million sublimit for the issuance of standby and commercial letters of credit and a $75 million sublimit for swing loan borrowings.
Borrowings under the Credit Facility will bear interest at an index based on SOFR (which will not be less than 0.00%) or, at our option, the Base Rate, plus, in either case, an applicable margin based on the average availability level under the Credit Facility. Base Rate is defined as the highest of (a) the Truist prime rate, (b) the Federal Funds Rate plus 0.50%, (c) one-month SOFR plus 1.00% and (d) 0.00%. The applicable margin for SOFR-based borrowings fluctuates between1.00%-1.50% and the applicable margin for Base Rate borrowings fluctuates between 0.00%-0.50%. An unused line fee shall be payable quarterly in respect of the total amount of the unutilized commitments under the Credit Facility, and a letter of credit plus a facing fee to the issuing bank. We are also required to pay certain fees to the administrative agent under the Credit Facility.
The Credit Facility contains customary covenants, including a financial covenant which requires us to maintain a minimum fixed charge coverage ratio of 1:1 when availability falls below certain thresholds established in the Credit Agreement, reporting requirements and events of default. The Credit Facility is secured by substantially all of our assets and the assets of our subsidiaries guaranteeing the Credit Facility, including (i) pledges of 100% of the stock or other equity interest of each domestic subsidiary that is directly owned by such entity and (ii) 65% of the stock or other equity interest of each foreign subsidiary that is directly owned by such entity, in each case subject to customary exceptions.
As of September 27, 2025, the previous $750 million Third Amended and Restated Credit Facility was in effect as described in Note 11 - Long-Term Debt.
Summarized Financial Information for Guarantors and the Issuer of Guaranteed Securities
Central (the "Parent/Issuer") issued $400 million of 2031 Notes in April 2021, $500 million of 2030 Notes in October 2020, and $300 million of 2028 Notes in December 2017. The 2031 Notes, 2030 Notes and 2028 Notes are fully and unconditionally guaranteed on a joint and several senior basis by each of our existing and future domestic restricted subsidiaries (the "Guarantors") which are guarantors of our Credit Facility. The 2031 Notes, 2030 Notes and 2028 Notes are unsecured senior obligations and are subordinated to all of our existing and future secured debt, including our Amended Credit Facility, to the extent of the value of the collateral securing such indebtedness. There are no significant restrictions on the ability of the Guarantors to make distributions to the Parent/Issuer. Certain subsidiaries and operating divisions of the Company do not guarantee the 2031, 2030 or 2028 Notes and are referred to as the Non-Guarantors.
The Guarantors jointly and severally, and fully and unconditionally, guarantee the payment of the principal and premium, if any, and interest on the 2031, 2030 and 2028 Notes when due, whether at stated maturity of the 2031, 2030 and 2028 Notes, by acceleration, call for redemption or otherwise, and all other obligations of the Company to the holders of the 2031, 2030 and 2028 Notes and to the trustee under the indenture governing the 2031, 2030 and 2028 Notes (the "Guarantee"). The Guarantees are senior unsecured obligations of each Guarantor and are of equal rank with all other existing and future senior indebtedness of the Guarantors.
The obligations of each Guarantor under its Guarantee shall be limited to the maximum amount, after giving effect to all other contingent and fixed liabilities of such Guarantor and to any collections from or payments made by or on behalf of any other Guarantor in
27
respect of the obligations of such Guarantor under the guarantee not constituting a fraudulent conveyance or fraudulent transfer under Federal or state law.
The Guarantee of a Guarantor will be released:
(1) upon any sale or other disposition of all or substantially all of the assets of that Guarantor (including by way of merger or consolidation), in accordance with the governing indentures, to any person other than the Company;
(2) if such Guarantor merges with and into the Company, with the Company surviving such merger;
(3) if such Guarantor is designated as an Unrestricted Subsidiary; or
(4) if the Company exercises its legal defeasance option or covenant defeasance option or the discharge of the Company's obligations under the indentures in accordance with the terms of the indentures.
The following tables present summarized financial information of the Parent/Issuer subsidiaries and the Guarantor subsidiaries. All intercompany balances and transactions between subsidiaries under Parent/Issuer and subsidiaries under the Guarantor have been eliminated. The information presented below excludes eliminations necessary to arrive at the information on a consolidated basis. In presenting the summarized financial statements, the equity method of accounting has been applied to the Parent/Issuer's interests in the Guarantor Subsidiaries. The summarized information excludes financial information of the Non-Guarantors, including earnings from and investments in these entities.
| Summarized Statements of Operations | Fiscal Year Ended | ||||||||||||||||||||||
| September 27, 2025 | September 28, 2024 | ||||||||||||||||||||||
| Parent/Issuer | Guarantors | Parent/Issuer | Guarantors | ||||||||||||||||||||
| (in thousands) | |||||||||||||||||||||||
| Net sales | $ | 770,812 | $ | 2,348,267 | $ | 694,083 | $ | 2,491,748 | |||||||||||||||
| Gross profit | 181,997 | 808,803 | 154,310 | 771,737 | |||||||||||||||||||
| Income (loss) from operations | (5,724) | 267,249 | (6,164) | 189,406 | |||||||||||||||||||
| Equity in earnings of Guarantor subsidiaries | 223,637 | — | 163,797 | — | |||||||||||||||||||
| Net income (loss) | (45,373) | 223,637 | (58,047) | 163,797 | |||||||||||||||||||
| Summarized Balance Sheet Information | As of | As of | |||||||||||||||||||||
| September 27, 2025 | September 28, 2024 | ||||||||||||||||||||||
| Parent/Issuer | Guarantors | Parent/Issuer | Guarantors | ||||||||||||||||||||
| (in thousands) | |||||||||||||||||||||||
| Current assets | $ | 1,065,394 | $ | 881,526 | $ | 936,497 | $ | 896,476 | |||||||||||||||
| Intercompany receivable from Non-guarantor subsidiaries | 71,716 | — | 76,084 | — | |||||||||||||||||||
| Other assets | 4,066,291 | 3,580,246 | 3,799,521 | 3,330,344 | |||||||||||||||||||
| Total assets | $ | 5,203,401 | $ | 4,461,772 | $ | 4,812,102 | $ | 4,226,820 | |||||||||||||||
| Current liabilities | $ | 165,447 | $ | 362,348 | $ | 164,607 | $ | 342,289 | |||||||||||||||
| Intercompany payable from Non-guarantor subsidiaries | — | 1,250 | — | 1,003 | |||||||||||||||||||
| Long-term debt | 1,191,541 | 100 | 1,189,655 | 154 | |||||||||||||||||||
| Other liabilities | 2,235,827 | 217,213 | 1,888,312 | 234,308 | |||||||||||||||||||
| Total liabilities | $ | 3,592,815 | $ | 580,911 | $ | 3,242,574 | $ | 577,754 | |||||||||||||||
28
Contractual Obligations
The table below presents our significant contractual cash obligations by fiscal year:
| Contractual Obligations | Fiscal 2026 | Fiscal 2027 | Fiscal 2028 | Fiscal 2029 | Fiscal 2030 | Thereafter | Total | |||||||||||||||||||||||||||||||||||||
| (in millions) | ||||||||||||||||||||||||||||||||||||||||||||
| Long-term debt, including current maturities (1) | $ | 0.1 | $ | 0.1 | $ | — | $ | — | $ | — | $ | 1,200.0 | $ | 1,200.2 | ||||||||||||||||||||||||||||||
| Interest payment obligations (2) | 52.5 | 52.5 | 44.8 | 37.1 | 26.8 | 16.5 | 230.2 | |||||||||||||||||||||||||||||||||||||
| Operating leases | 67.2 | 56.1 | 44.3 | 37.9 | 32.5 | 56.7 | 294.7 | |||||||||||||||||||||||||||||||||||||
| Purchase commitments (3) | 85.0 | 10.2 | 7.6 | 3.8 | 1.5 | — | 108.1 | |||||||||||||||||||||||||||||||||||||
| Performance-based payments (4) | — | — | — | — | — | — | — | |||||||||||||||||||||||||||||||||||||
| Total | $ | 204.8 | $ | 118.9 | $ | 96.7 | $ | 78.8 | $ | 60.8 | $ | 1,273.2 | $ | 1,833.2 | ||||||||||||||||||||||||||||||
(1)Excludes $3.0 million of outstanding letters of credit related to normal business transactions. Debt repayments do not reflect the unamortized portion of deferred financing costs associated with the 2028 Notes, 2030 Notes and 2031 Notes of approximately $8.5 million as of September 27, 2025, of which $1.1 million is amortizable until February 2028, $4.0 million is amortizable until October 2030 and $3.4 million is amortizable until April 2031, and is included in the carrying value of the long-term debt. See Note 11 - Long-Term Debt to the consolidated financial statements for further discussion of long-term debt.
(2)Estimated interest payments to be made on our 2028 Notes, our 2030 Notes and our 2031 Notes. See Note 11 - Long-Term Debt to the consolidated financial statements for description of interest rate terms.
(3)Contracts for purchases of grains, grass seed and pet food ingredients, used primarily to mitigate risk associated with increases in market prices and commodity availability, may obligate us to make future purchases based on estimated yields. The terms of these contracts vary; some having fixed prices or quantities, others having variable pricing and quantities. For certain agreements, management estimates are used to develop the quantities and pricing for anticipated purchases, and future purchases could vary significantly from such estimates.
(4)Possible performance-based payments associated with prior acquisitions of businesses are not included in the above table, because they are based on future performance of the businesses acquired, which is not yet known.
Recent Accounting Pronouncements
Refer to the discussion under Part II, Item 8, Notes to Consolidated Financial Statements, Note 1 – Organization and Significant Accounting Policies for a summary of recent accounting pronouncements.
Critical Accounting Policies, Estimates and Judgments
Our discussion and analysis of our financial condition and results of operations is based upon our consolidated financial statements, which have been prepared in accordance with accounting principles generally accepted in the United States of America. The preparation of these financial statements requires us to make estimates and judgments that affect the reported amounts and related disclosures in the consolidated financial statements. Estimates and assumptions are required for, among other items, accounts receivable and inventory realizable values, fixed asset lives, long-lived asset valuation and impairments, intangible asset lives, stock-based compensation, deferred and current income taxes, self-insurance accruals and the impact of contingencies and litigation. We base our estimates on historical experience and on various other assumptions that are believed to be reasonable under the circumstances, the result of which forms the basis for making judgments about the carrying value of assets and liabilities that are not readily apparent from other sources. Actual results may differ from those estimates under different assumptions or conditions.
Although not all inclusive, we believe that the following represent the more critical accounting policies, which are subject to estimates and assumptions used in the preparation of our consolidated financial statements.
Goodwill
Goodwill represents the excess of cost of an acquired business over the fair value of the identifiable tangible and intangible assets acquired and liabilities assumed in a business combination. Identifiable intangible assets acquired in business combinations are recorded based on their fair values at the date of acquisition. Goodwill and identifiable intangible assets with indefinite lives are not subject to amortization but must be evaluated for impairment.
We test goodwill for impairment annually (as of the first day of the fourth fiscal quarter), or whenever events occur or circumstances change that would more likely than not reduce the fair value of a reporting unit below its carrying amount, by first assessing qualitative factors to determine whether it is more likely than not the fair value of the reporting unit is less than its carrying amount. The qualitative assessment
29
evaluates factors including macro-economic conditions, industry-specific and company-specific considerations, legal and regulatory environments and historical performance. If it is determined that it is more likely than not the fair value of the reporting unit is greater than its carrying amount, it is unnecessary to perform the quantitative goodwill impairment test. If it is determined that it is more likely than not that the fair value of the reporting unit is less than its carrying amount, the quantitative test is performed to identify potential goodwill impairment. Based on certain circumstances, we may elect to bypass the qualitative assessment and proceed directly to performing the quantitative goodwill impairment test, which compares the estimated fair value of our reporting units to their related carrying values, including goodwill. Impairment is indicated if the estimated fair value of the reporting unit is less than its carrying value, and an impairment charge is recognized for the differential. Our goodwill impairment analysis also includes a comparison of the aggregate estimated fair value of our two reporting segments to the Company’s total market capitalization.
Determining the fair value of a reporting segment involves the use of significant estimates and assumptions. The estimate of fair value of each of our reporting segments is based on our projection of revenues, gross margin, operating costs and cash flows considering historical and estimated future results, general economic and market conditions as well as the impact of planned business and operational strategies. We base our fair value estimates on assumptions we believe to be reasonable at the time, but such assumptions are subject to inherent uncertainty. Assumptions critical to our fair value estimates were: (i) discount rates used in determining the fair value of the reporting segments; (ii) estimated future cash flows; and (iii) projected revenue and operating profit growth rates used in the reporting segment models. Actual results may differ from those estimates. The valuations employ present value techniques to measure fair value and consider market factors.
Our goodwill is associated with our Pet segment and our Garden segment. In connection with our annual goodwill impairment testing performed during fiscal 2025, we made a qualitative evaluation about the likelihood of goodwill impairment to determine whether it was necessary to calculate the fair values of our reporting segments under the goodwill impairment test. We completed our qualitative assessment of potential goodwill impairment and determined that it was more likely than not the fair values of our reporting segments were greater than their carrying amount in fiscal year 2025, and accordingly, no further testing of goodwill was required in fiscal 2025.
In connection with our annual goodwill impairment testing performed during fiscal year 2024, we made a qualitative evaluation about the likelihood of goodwill impairment to determine whether it was necessary to calculate the fair values of our reporting segments under the goodwill impairment test. We completed our qualitative assessment of potential goodwill impairment and determined that it was more likely than not the fair values of our reporting segments were greater than their carrying amount in fiscal year 2024, and accordingly, no further testing of goodwill was required in fiscal year 2024.
In connection with our annual goodwill impairment testing performed during fiscal 2023, we elected to bypass the qualitative assessment and proceeded directly to performing the quantitative goodwill impairment test. We completed our quantitative assessment of potential goodwill and determined that it was more likely than not the fair values of our reporting segments were greater than their carrying amounts.
Changes in the judgments and estimates underlying our analysis of goodwill for possible impairment, including expected future cash flows and discount rates, could result in a significantly different estimate of the fair value of the reporting units in the future and could result in additional impairment of goodwill.
Intangible assets
Indefinite-lived intangible assets consist primarily of acquired trade names and trademarks. Indefinite-lived intangible assets are tested annually for impairment or whenever events or changes in circumstances occur indicating that the carrying amount of the asset may not be recoverable. An impairment loss would be recognized for an intangible asset with an indefinite useful life if its carrying value exceeds its fair value.
Indefinite-lived intangible assets are primarily tested for impairment by comparing the fair value of the asset to the carrying value. Fair value is determined based on discounted cash flow analyses that include significant management assumptions such as revenue growth rates, discount rates, weighted average cost of capital, and assumed royalty rates. Future net sales and short-term growth rates are estimated for trade names based on management’s forecasted financial results which consider key business drivers such as specific revenue growth initiatives, market share changes and general economic factors such as consumer spending.
During fiscal 2025, 2024 and 2023, we performed evaluations of the fair value of our indefinite-lived trade names and trademarks. Our expected revenues were based on our future operating plan and market growth or decline estimates for future years. We recognized impairment losses on certain intangible assets of $1.0 million, $12.8 million and $11.5 million in fiscal 2025, 2024 and 2023, respectively.
Item 7A. Quantitative and Qualitative Disclosure About Market Risk
We are exposed to market risks, which include changes in U.S. interest rates and commodity prices and, to a lesser extent, foreign exchange rates. We do not engage in financial transactions for trading or speculative purposes.
30
Interest Rate Risk. The interest payable on our Amended Credit Facility is based on variable interest rates and therefore affected by changes in market interest rates. We had no variable rate debt outstanding as of September 27, 2025 under our Credit Facility. However, if our Credit Facility were fully drawn and interest rates changed by 25 basis points compared to actual rates, interest expense would have increased or decreased by approximately $1.9 million. In addition, we have investments consisting of cash equivalents and short-term investments, which are also affected by changes in market interest rates.
Commodity Prices. We are exposed to fluctuations in market prices for grains, grass seed, chemicals, fertilizer ingredients and pet treat ingredients. To mitigate risk associated with increases in market prices and commodity availability, we enter into contracts for purchases, primarily to ensure commodity availability to us in the future. As of September 27, 2025, we had entered into fixed purchase commitments for commodities totaling approximately $108.1 million. A 10% change in the market price for these commodities would have resulted in an additional pretax gain or loss of $10.8 million as the related inventory containing those inputs is sold.
Foreign Currency Risks. Our market risk associated with foreign currency rates is not material. To date, we have had minimal sales outside of the United States. Purchases made by our U.S. subsidiaries from foreign vendors are primarily made in U.S. dollars. Our international subsidiary transacts most of its business in British pounds and Canadian dollars. Therefore, we have only minimal exposure to foreign currency exchange risk. We do not hedge against foreign currency risks and believe that foreign currency exchange risk is immaterial to our current business.
31
Item 8. Financial Statements and Supplementary Data
See pages beginning at F-1.
Item 9. Changes in and Disagreements With Accountants on Accounting and Financial Disclosure
None.
Item 9A. Controls and Procedures
Evaluation of Disclosure Controls and Procedures
Our Principal Executive Officer and Principal Financial Officer have reviewed, as of the end of the period covered by this report, the “disclosure controls and procedures” (as defined in the Securities Exchange Act of 1934 Rules 13a-15(e) and 15d-15(e)) that ensure that information relating to the Company required to be disclosed by us in the reports that we file or submit under the Exchange Act is recorded, processed, summarized and reported in a timely and proper manner and that such information is accumulated and communicated to our management, including our Principal Executive Officer and Principal Financial Officer, as appropriate to allow timely decisions regarding required disclosure. Based upon this review, such officers concluded that our disclosure controls and procedures were effective as of September 27, 2025.
Changes in Internal Control Over Financial Reporting
Our management, with the participation of our Principal Executive Officer and Principal Financial Officer, has evaluated whether any change in our internal control over financial reporting occurred during the fourth quarter of fiscal 2025. Based on that evaluation, management concluded that there has been no change in our internal control over financial reporting during the fourth quarter of fiscal 2025 that has materially affected, or is reasonably likely to materially affect, our internal control over financial reporting.
Management’s Report on Internal Control Over Financial Reporting
A copy of our management’s report and the report of Deloitte & Touche LLP, our independent registered public accounting firm, are included in our Financial Statements and Supplementary Data beginning on page F-1.
Item 9B. Other Information
During the quarter ended September 27, 2025, none of our directors or officers informed us of the adoption termination
Item 9C. Disclosure Regarding Foreign Jurisdictions that Prevent Inspections
None.
PART III
Item 10. Directors, Executive Officers and Corporate Governance
We have adopted a code of ethics that applies to all of our executive officers and directors, a copy of which is available on our website at www.central.com/about-us/what-we-stand-for.
The remaining information required by this item is incorporated by reference from Central’s Definitive Proxy Statement for its 2026 Annual Meeting of Shareholders under the captions “Election of Directors,” “Further Information Concerning the Board of Directors – Committees of the Board”, “Delinquent Section 16(a) Reports,” “Code of Ethics,” and "Restrictions on Transactions in Company Stock by Directors and Officers." See also Item 1 – Business above.
Item 11. Executive Compensation
The information required by this item is incorporated by reference from Central’s Definitive Proxy Statement for its 2026 Annual Meeting of Shareholders under the captions “Executive Compensation” and “Further Information Concerning the Board of Directors – Compensation Committee Interlocks and Insider Participation.”
Item 12. Security Ownership of Certain Beneficial Owners and Management and Related Stockholder Matters
The information required by this item is incorporated by reference from Central’s Definitive Proxy Statement for its 2026 Annual Meeting of Shareholders under the captions “Stock Ownership of Management and Principal Shareholders” and "Executive Compensation – Equity Compensation Plan Information.”
32
Item 13. Certain Relationships and Related Transactions, and Director Independence
The information required by this item is incorporated by reference from Central’s Definitive Proxy Statement for its 2026 Annual Meeting of Shareholders under the captions “Further Information Concerning the Board of Directors – Board Independence” and “Transactions with the Company.”
Item 14. Principal Accountant Fees and Services
The information required by this item is incorporated by reference from Central’s Definitive Proxy Statement for its 2026 Annual Meeting of Shareholders under the caption “Ratification of Selection of Independent Registered Public Accounting Firm.”
PART IV
Item 15. Exhibits and Financial Statement Schedules
(a)The following documents are filed as part of this report:
(i)Consolidated Financial Statements of Central Garden & Pet Company are attached to this Form 10-K beginning on page F-1:
Management’s Report on Internal Control Over Financial Reporting
Reports of Independent Registered Public Accounting Firm
Consolidated Balance Sheets
Consolidated Statements of Operations
Consolidated Statements of Comprehensive Income
Consolidated Statements of Shareholders’ Equity
Consolidated Statements of Cash Flows
Notes to Consolidated Financial Statements
All other schedules are omitted because of the absence of conditions under which they are required or because the required information is included in the consolidated financial statements or notes thereto.
(2)Exhibits:
Set forth below is a list of exhibits that are being filed or incorporated by reference into this Form 10-K:
| Incorporated by Reference | ||||||||||||||||||||||||||||||||||||||||||||
| Exhibit Number | Exhibit | Form | File No. | Exhibit | Filing Date | Filed Herewith | Furnished, Not Filed | |||||||||||||||||||||||||||||||||||||
| 10-K | 001-33268 | 3.1 | 12/14/2006 | |||||||||||||||||||||||||||||||||||||||||
| 8-K | 001-33268 | 3.1 | 4/1/2022 | |||||||||||||||||||||||||||||||||||||||||
| 10-K | 001-33268 | 4.1 | 11/29/2017 | |||||||||||||||||||||||||||||||||||||||||
| 10-K | 001-33268 | 4.2 | 11/29/2017 | |||||||||||||||||||||||||||||||||||||||||
| 8-K | 001-33268 | 4.2 | 3/8/2010 | |||||||||||||||||||||||||||||||||||||||||
| 8-K | 001-33268 | 4.1 | 12/14/2017 | |||||||||||||||||||||||||||||||||||||||||
| 10-Q | 001-33268 | 4.1 | 5/7/2019 | |||||||||||||||||||||||||||||||||||||||||
| 10-Q | 001-33268 | 4.1 | 8/2/2019 | |||||||||||||||||||||||||||||||||||||||||
| 8-K | 001-33268 | 4.1 | 10/16/2020 | |||||||||||||||||||||||||||||||||||||||||
| 10-Q | 001-33268 | 4.1 | 5/6/20213 | |||||||||||||||||||||||||||||||||||||||||
| 10-Q | 001-33268 | 4.2 | 5/6/20213 | |||||||||||||||||||||||||||||||||||||||||
| 10-Q | 001-33268 | 4.1 | 5/4/2023 | |||||||||||||||||||||||||||||||||||||||||
| 10-Q | 001-33268 | 4.2 | 8/8/2024 | |||||||||||||||||||||||||||||||||||||||||
| 8-K | 001-33268 | 4.1 | 4/30/2021 | |||||||||||||||||||||||||||||||||||||||||
| 10-Q | 001-33268 | 4.2 | 5/4/2023 | |||||||||||||||||||||||||||||||||||||||||
| 10-Q | 001-33268 | 4.1 | 8/8/2024 | |||||||||||||||||||||||||||||||||||||||||
| 10-K | 001-33268 | 4.12 | 11/27/2019 | |||||||||||||||||||||||||||||||||||||||||
| 10-K | 001-33268 | 10.1 | 11/29/2017 | |||||||||||||||||||||||||||||||||||||||||
| 8-K | 001-33268 | 10.1 | 11/12/2025 | |||||||||||||||||||||||||||||||||||||||||
| 8-K | 001-33268 | 10.2 | 2/15/2012 | |||||||||||||||||||||||||||||||||||||||||
| 10-K | 000-20242 | 10.5.1 | 12/9/2004 | |||||||||||||||||||||||||||||||||||||||||
| 10-K | 000-20242 | 10.5.2 | 12/9/2004 | |||||||||||||||||||||||||||||||||||||||||
| 10-K | 001-33268 | 10.4.3 | 11/19/2010 | |||||||||||||||||||||||||||||||||||||||||
| 8-K | 001-33268 | 10.1 | 2/9/2022 | |||||||||||||||||||||||||||||||||||||||||
| 10-K | 001-33268 | 10.7 | 11/24/2020 | |||||||||||||||||||||||||||||||||||||||||
| 10-Q | 000-20242 | 10.6.1 | 2/3/2005 | |||||||||||||||||||||||||||||||||||||||||
| 10-Q | 000-20242 | 10.6.2 | 2/3/2005 | |||||||||||||||||||||||||||||||||||||||||
| 8-K | 000-20242 | 10.1 | 10/14/2005 | |||||||||||||||||||||||||||||||||||||||||
| 8-K | 000-20242 | 10.2 | 10/14/2005 | |||||||||||||||||||||||||||||||||||||||||
| 10-K | 001-33268 | 10.23 | 11/27/2024 | |||||||||||||||||||||||||||||||||||||||||
| 10-K | 001-33268 | 10.24 | 11/27/2024 | |||||||||||||||||||||||||||||||||||||||||
| 10-K | 001-33268 | 19 | 11/27/2024 | |||||||||||||||||||||||||||||||||||||||||
| X | ||||||||||||||||||||||||||||||||||||||||||||
| X | ||||||||||||||||||||||||||||||||||||||||||||
| X | ||||||||||||||||||||||||||||||||||||||||||||
| X | ||||||||||||||||||||||||||||||||||||||||||||
| X | ||||||||||||||||||||||||||||||||||||||||||||
| X | ||||||||||||||||||||||||||||||||||||||||||||
| X | ||||||||||||||||||||||||||||||||||||||||||||
| X | ||||||||||||||||||||||||||||||||||||||||||||
| 101 | The following financial statements from the Company's Annual Report on Form 10-K for the year ended September 27, 2025, formatted in Inline XBRL: (i) Consolidated Balance Sheet, (ii) Consolidated Statements of Operations, (iii) Consolidated Statements of Comprehensive Income, (iv) Consolidated Statements of Equity, (v) Consolidated Statements of Cash Flows, and (vi) Notes to Consolidated Financial Statements, tagged as block text and including detailed tags. | X | ||||||||||||||||||||||||||||||||||||||||||
| 104 | Cover Page Interactive Data File - the cover page iXBRL tags are embedded within the Inline XBRL document. | |||||||||||||||||||||||||||||||||||||||||||
| * | Management contract or compensatory plan or arrangement | |||||||||||||||||||||||||||||||||||||||||||
33
Item 16. Form 10-K Summary
Not applicable.
SIGNATURES
Pursuant to the requirements of Section 13 or 15(d) of the Securities Exchange Act of 1934, the registrant has duly caused this report to be signed on its behalf by the undersigned, thereunto duly authorized.
Date: November 26, 2025
| CENTRAL GARDEN & PET COMPANY | ||||||||
| By | /s/ Nicholas Lahanas | |||||||
| Nicholas Lahanas | ||||||||
| Chief Executive Officer | ||||||||
Pursuant to the requirements of the Securities Exchange Act of 1934, this report has been signed below by the following persons on behalf of the registrant and in the capacities indicated.
| Signature | Capacity | Date | ||||||||||||
| /s/ Nicholas Lahanas | Chief Executive Officer (Principal Executive Officer) | November 26, 2025 | ||||||||||||
| Nicholas Lahanas | ||||||||||||||
| /s/ Bradley G. Smith | Chief Financial Officer (Principal Financial Officer) | November 26, 2025 | ||||||||||||
| Bradley G. Smith | ||||||||||||||
| /s/ Howard A. Machek | Senior Vice President and Chief Accounting Officer (Principal Accounting Officer) | November 26, 2025 | ||||||||||||
| Howard A. Machek | ||||||||||||||
| /s/ William E. Brown | Chairman | November 26, 2025 | ||||||||||||
| William E. Brown | ||||||||||||||
| /s/ Mary Beth Springer | Director | November 26, 2025 | ||||||||||||
| Mary Beth Springer | ||||||||||||||
| /s/ Courtnee Chun | Director | November 26, 2025 | ||||||||||||
| Courtnee Chun | ||||||||||||||
| /s/ Lisa Coleman | Director | November 26, 2025 | ||||||||||||
| Lisa Coleman | ||||||||||||||
| /s/ Brendan P. Dougher | Director | November 26, 2025 | ||||||||||||
| Brendan P. Dougher | ||||||||||||||
| /s/ Randal D. Lewis | Director | November 26, 2025 | ||||||||||||
| Randal D. Lewis | ||||||||||||||
| /s/ Christopher Metz | Director | November 26, 2025 | ||||||||||||
| Christopher Metz | ||||||||||||||
| /s/ Brooks M. Pennington III | Director | November 26, 2025 | ||||||||||||
| Brooks M. Pennington III | ||||||||||||||
| /s/ John R. Ranelli | Director | November 26, 2025 | ||||||||||||
| John R. Ranelli | ||||||||||||||
34
INDEX TO CONSOLIDATED FINANCIAL STATEMENTS
| Central Garden & Pet Company | |||||
Reports of Independent Registered Public Accounting Firm (PCAOB ID No. | |||||
F-1
MANAGEMENT’S REPORT ON INTERNAL CONTROL OVER FINANCIAL REPORTING
Central Garden & Pet Company’s management, under the supervision of Central’s Principal Executive Officer and Principal Financial Officer, is responsible for establishing and maintaining effective internal control over financial reporting (as defined in Rule 13a-15(f) or 15d-15(f) under the Exchange Act). Management evaluated the effectiveness of Central’s internal control over financial reporting based on the framework in Internal Control – Integrated Framework (2013) issued by the Committee of Sponsoring Organizations (“COSO”) of the Treadway Commission. The scope of management's assessment of the effectiveness of our internal control over financial reporting included all of our consolidated operations. Based upon this assessment, such officers concluded the Company maintained effective internal control over financial reporting as of September 27, 2025.
Our independent registered public accounting firm, Deloitte & Touche LLP, has issued a report on our internal control over financial reporting, which appears on page F-5 of this Form 10-K.
Because of the inherent limitations of internal control over financial reporting, including the possibility of collusion or improper management override of controls, material misstatements due to error or fraud may not be prevented or detected on a timely basis. Also, projections of any evaluation of the effectiveness of the internal control over financial reporting to future periods are subject to the risk that the controls may become ineffective because of changes in conditions, or that the degree of compliance with the policies or procedures may deteriorate.
F-2
REPORT OF INDEPENDENT REGISTERED PUBLIC ACCOUNTING FIRM
To the shareholders and the Board of Directors of Central Garden & Pet Company
Opinion on the Financial Statements
We have audited the accompanying consolidated balance sheets of Central Garden & Pet Company and subsidiaries (the "Company") as of September 27, 2025 and September 28, 2024, the related consolidated statements of operations, comprehensive income, equity, and cash flows, for each of the fiscal years ended September 27, 2025, September 28, 2024, and September 30, 2023 and the related notes (collectively referred to as the "financial statements"). In our opinion, the financial statements present fairly, in all material respects, the financial position of the Company as of September 27, 2025 and September 28, 2024, and the results of its operations and its cash flows for each of the fiscal years ended September 27, 2025, September 28, 2024, and September 30, 2023, in conformity with accounting principles generally accepted in the United States of America.
We have also audited, in accordance with the standards of the Public Company Accounting Oversight Board (United States) (PCAOB), the Company's internal control over financial reporting as of September 27, 2025, based on criteria established in Internal Control — Integrated Framework (2013) issued by the Committee of Sponsoring Organizations of the Treadway Commission and our report dated November 26, 2025, expressed an unqualified opinion on the Company's internal control over financial reporting.
Basis for Opinion
These financial statements are the responsibility of the Company's management. Our responsibility is to express an opinion on the Company's financial statements based on our audits. We are a public accounting firm registered with the PCAOB and are required to be independent with respect to the Company in accordance with the U.S. federal securities laws and the applicable rules and regulations of the Securities and Exchange Commission and the PCAOB.
We conducted our audits in accordance with the standards of the PCAOB. Those standards require that we plan and perform the audit to obtain reasonable assurance about whether the financial statements are free of material misstatement, whether due to error or fraud. Our audits included performing procedures to assess the risks of material misstatement of the financial statements, whether due to error or fraud, and performing procedures that respond to those risks. Such procedures included examining, on a test basis, evidence regarding the amounts and disclosures in the financial statements. Our audits also included evaluating the accounting principles used and significant estimates made by management, as well as evaluating the overall presentation of the financial statements. We believe that our audits provide a reasonable basis for our opinion.
Critical Audit Matter
The critical audit matter communicated below is a matter arising from the current-period audit of the financial statements that was communicated or required to be communicated to the audit committee and that (1) relates to accounts or disclosures that are material to the financial statements and (2) involved our especially challenging, subjective, or complex judgments. The communication of critical audit matters does not alter in any way our opinion on the financial statements, taken as a whole, and we are not, by communicating the critical audit matter below, providing a separate opinion on the critical audit matter or on the accounts or disclosures to which it relates.
Net Sales - Revenue Recognition for Consignment Arrangements — Refer to Note 1 to the financial statements
Critical Audit Matter Description
Under consignment arrangements, a component of the Garden segment net sales, the customer receives the product at its retail locations, but the Company retains the title to the product until it is purchased by the retail consumer. When products are sold under consignment arrangements, the Company recognizes revenue when control over such products has transferred to the retail consumer. The initiation, processing, and recording of certain transactions under a specific consignment arrangement with a retailer customer relies upon the accuracy and completeness of revenues reported by its customer and revenue transaction processing services provided by a third party.
We identified revenue recognition for this consignment arrangement included in net sales for the fiscal year ended September 27, 2025, to be a critical audit matter because of the nature of the information used by the Company to recognize revenue. This required a high degree of audit judgment and an increased extent of effort to evaluate the accuracy and completeness of information reported by the Company’s customer and third-party transaction processing services provider.
How the Critical Audit Matter Was Addressed in the Audit
Our audit procedures related to revenue recognized for this consignment arrangement included the following, among others:
•We tested the effectiveness of controls over recognizing consignment revenue.
F-3
•With the assistance of data specialists, we created data visualizations to analyze journal entries to (i) identify significant transaction types in the revenue population and (ii) evaluate trends in the transactional revenue data, significant transaction types, and related accounts affecting revenue.
•For a sample of transactions, we performed a test of details on those related accounts determined to have a significant relationship with revenue, including accounts receivable and cash collections.
•We performed a proof of cash reconciliation that reconciled cash deposits to revenue recognized throughout the year. For a selection of deposits received during the period, we performed detailed transaction testing, including agreeing the amount of the deposit received and the amount recognized as revenue during the period to underlying source documents, including cash receipts.
•We selected a sample of credits issued after the end of the fiscal year and performed detailed transaction testing by agreeing the credit amount to documents supporting the authorization of the issuance of the credit and to evaluate if the credit was recognized in the correct period.
/s/ DELOITTE & TOUCHE LLP
November 26, 2025
We have served as the Company's auditor since at least 1987; however, an earlier year could not be reliably determined.
F-4
REPORT OF INDEPENDENT REGISTERED PUBLIC ACCOUNTING FIRM
To the shareholders and the Board of Directors of Central Garden & Pet Company
Opinion on Internal Control over Financial Reporting
We have audited the internal control over financial reporting of Central Garden & Pet Company and subsidiaries (the "Company") as of September 27, 2025, based on criteria established in Internal Control — Integrated Framework (2013) issued by the Committee of Sponsoring Organizations of the Treadway Commission (COSO). In our opinion, the Company maintained, in all material respects, effective internal control over financial reporting as of September 27, 2025, based on criteria established in Internal Control — Integrated Framework (2013) issued by COSO.
We have also audited, in accordance with the standards of the Public Company Accounting Oversight Board (United States) (PCAOB), the consolidated financial statements as of and for the fiscal year ended September 27, 2025, of the Company and our report dated November 26, 2025, expressed an unqualified opinion on those financial statements.
Basis for Opinion
The Company's management is responsible for maintaining effective internal control over financial reporting and for its assessment of the effectiveness of internal control over financial reporting, included in the accompanying Management's Report on Internal Control over Financial Reporting. Our responsibility is to express an opinion on the Company's internal control over financial reporting based on our audit. We are a public accounting firm registered with the PCAOB and are required to be independent with respect to the Company in accordance with the U.S. federal securities laws and the applicable rules and regulations of the Securities and Exchange Commission and the PCAOB.
We conducted our audit in accordance with the standards of the PCAOB. Those standards require that we plan and perform the audit to obtain reasonable assurance about whether effective internal control over financial reporting was maintained in all material respects. Our audit included obtaining an understanding of internal control over financial reporting, assessing the risk that a material weakness exists, testing and evaluating the design and operating effectiveness of internal control based on the assessed risk, and performing such other procedures as we considered necessary in the circumstances. We believe that our audit provides a reasonable basis for our opinion.
Definition and Limitations of Internal Control over Financial Reporting
A company's internal control over financial reporting is a process designed to provide reasonable assurance regarding the reliability of financial reporting and the preparation of financial statements for external purposes in accordance with generally accepted accounting principles. A company's internal control over financial reporting includes those policies and procedures that (1) pertain to the maintenance of records that, in reasonable detail, accurately and fairly reflect the transactions and dispositions of the assets of the company; (2) provide reasonable assurance that transactions are recorded as necessary to permit preparation of financial statements in accordance with generally accepted accounting principles, and that receipts and expenditures of the company are being made only in accordance with authorizations of management and directors of the company; and (3) provide reasonable assurance regarding prevention or timely detection of unauthorized acquisition, use, or disposition of the company's assets that could have a material effect on the financial statements.
Because of its inherent limitations, internal control over financial reporting may not prevent or detect misstatements. Also, projections of any evaluation of effectiveness to future periods are subject to the risk that controls may become inadequate because of changes in conditions, or that the degree of compliance with the policies or procedures may deteriorate.
/s/ DELOITTE & TOUCHE LLP
November 26, 2025
F-5
CENTRAL GARDEN & PET COMPANY
CONSOLIDATED BALANCE SHEETS
| September 27, 2025 | September 28, 2024 | |||||||||||||
| (in thousands, except share and per share amount) | ||||||||||||||
| ASSETS | ||||||||||||||
| Current assets: | ||||||||||||||
| Cash and cash equivalents | $ | $ | ||||||||||||
| Restricted cash | ||||||||||||||
| Accounts receivable, net | ||||||||||||||
| Inventories, net | ||||||||||||||
| Prepaid expenses and other | ||||||||||||||
| Total current assets | ||||||||||||||
| Plant, property and equipment, net | ||||||||||||||
| Goodwill | ||||||||||||||
| Other intangible assets, net | ||||||||||||||
| Operating lease right-of-use assets | ||||||||||||||
| Other assets | ||||||||||||||
| Total | $ | $ | ||||||||||||
| LIABILITIES AND EQUITY | ||||||||||||||
| Current liabilities: | ||||||||||||||
| Accounts payable | $ | $ | ||||||||||||
| Accrued expenses | ||||||||||||||
| Current lease liabilities | ||||||||||||||
| Current portion of long-term debt | ||||||||||||||
| Total current liabilities | ||||||||||||||
| Long-term debt | ||||||||||||||
| Long-term lease liabilities | ||||||||||||||
| Deferred income taxes and other long-term obligations | ||||||||||||||
Commitments and contingencies (Note 12) | ||||||||||||||
| Equity: | ||||||||||||||
Common stock ($ | ||||||||||||||
Class A common stock ($ | ||||||||||||||
Class B stock ($ | ||||||||||||||
| Additional paid-in capital | ||||||||||||||
| Retained earnings | ||||||||||||||
| Accumulated other comprehensive loss | ( | ( | ||||||||||||
| Total Central Garden & Pet shareholders’ equity | ||||||||||||||
| Noncontrolling interest | ||||||||||||||
| Total equity | ||||||||||||||
| Total | $ | $ | ||||||||||||
See notes to consolidated financial statements.
F-6
CENTRAL GARDEN & PET COMPANY
CONSOLIDATED STATEMENTS OF OPERATIONS
| Fiscal Year Ended | ||||||||||||||||||||
| September 27, 2025 | September 28, 2024 | September 30, 2023 | ||||||||||||||||||
| (in thousands, except per share amounts) | ||||||||||||||||||||
| Net sales | $ | $ | $ | |||||||||||||||||
| Cost of goods sold | ||||||||||||||||||||
| Gross profit | ||||||||||||||||||||
| Selling, general and administrative expenses | ||||||||||||||||||||
| Operating income | ||||||||||||||||||||
| Interest expense | ( | ( | ( | |||||||||||||||||
| Interest income | ||||||||||||||||||||
| Other income (expense), net | ( | ( | ||||||||||||||||||
| Income before income taxes and noncontrolling interest | ||||||||||||||||||||
| Income tax expense | ||||||||||||||||||||
| Net income including noncontrolling interest | ||||||||||||||||||||
| Net income attributable to noncontrolling interest | ||||||||||||||||||||
| Net income attributable to Central Garden & Pet Company | $ | $ | $ | |||||||||||||||||
| Net income per share attributable to Central Garden & Pet Company: | ||||||||||||||||||||
| Basic | $ | $ | $ | |||||||||||||||||
| Diluted | $ | $ | $ | |||||||||||||||||
| Weighted average shares used in the computation of net income per share: | ||||||||||||||||||||
| Basic | ||||||||||||||||||||
| Diluted | ||||||||||||||||||||
See notes to consolidated financial statements.
F-7
CENTRAL GARDEN & PET COMPANY
CONSOLIDATED STATEMENTS OF COMPREHENSIVE INCOME
| Fiscal Year Ended | ||||||||||||||||||||
| September 27, 2025 | September 28, 2024 | September 30, 2023 | ||||||||||||||||||
| (in thousands) | ||||||||||||||||||||
| Net income | $ | $ | $ | |||||||||||||||||
| Other comprehensive income (loss): | ||||||||||||||||||||
| Foreign currency translation, net of tax | ( | |||||||||||||||||||
| Total comprehensive income | ||||||||||||||||||||
| Comprehensive income attributable to noncontrolling interest | ||||||||||||||||||||
| Comprehensive income attributable to Central Garden & Pet Company | $ | $ | $ | |||||||||||||||||
See notes to consolidated financial statements.
F-8
CENTRAL GARDEN & PET COMPANY
CONSOLIDATED STATEMENTS OF EQUITY
| Central Garden & Pet Company | |||||||||||||||||||||||||||||||||||||||||||||||||||||||||||||||||||||||
| (in thousands, except per share amounts) | |||||||||||||||||||||||||||||||||||||||||||||||||||||||||||||||||||||||
| Common Stock | Class A Common Stock | Class B Stock | Additional Paid-in Capital | Retained Earnings | Accumulated Other Comprehensive Income (Loss) | Total | Non-controlling Interest | Total Equity | |||||||||||||||||||||||||||||||||||||||||||||||||||||||||||||||
| Shares | Amount | Shares | Amount | Shares | Amount | ||||||||||||||||||||||||||||||||||||||||||||||||||||||||||||||||||
| Balance, September 24, 2022 | $ | $ | $ | $ | $ | $ | ( | $ | $ | $ | |||||||||||||||||||||||||||||||||||||||||||||||||||||||||||||
| Amortization of share-based awards | — | — | — | — | — | — | — | — | — | ||||||||||||||||||||||||||||||||||||||||||||||||||||||||||||||
| Restricted share activity | — | — | — | — | ( | — | — | ( | — | ( | |||||||||||||||||||||||||||||||||||||||||||||||||||||||||||||
| Share conversion | — | — | — | ( | — | — | — | — | — | — | — | ||||||||||||||||||||||||||||||||||||||||||||||||||||||||||||
| Issuance of common stock | — | — | — | — | — | — | — | ||||||||||||||||||||||||||||||||||||||||||||||||||||||||||||||||
| Repurchase of stock | ( | (2) | ( | ( | — | — | ( | ( | — | ( | — | ( | |||||||||||||||||||||||||||||||||||||||||||||||||||||||||||
| Other comprehensive income | — | — | — | — | — | — | — | — | — | ||||||||||||||||||||||||||||||||||||||||||||||||||||||||||||||
| Net income | — | — | — | — | — | — | — | — | |||||||||||||||||||||||||||||||||||||||||||||||||||||||||||||||
| Balance, September 30, 2023 | ( | ||||||||||||||||||||||||||||||||||||||||||||||||||||||||||||||||||||||
| Amortization of share-based awards | — | — | — | — | — | — | — | — | — | ||||||||||||||||||||||||||||||||||||||||||||||||||||||||||||||
| Restricted share activity | — | — | ( | ( | — | — | ( | — | — | ( | — | ( | |||||||||||||||||||||||||||||||||||||||||||||||||||||||||||
| Issuance of common stock | — | — | — | — | — | — | — | ||||||||||||||||||||||||||||||||||||||||||||||||||||||||||||||||
| Distribution to noncontrolling interest | — | — | — | — | — | — | — | — | — | — | ( | ( | |||||||||||||||||||||||||||||||||||||||||||||||||||||||||||
| Repurchase of stock | ( | — | ( | ( | — | — | ( | ( | — | ( | — | ( | |||||||||||||||||||||||||||||||||||||||||||||||||||||||||||
| Other comprehensive income | — | — | — | — | — | — | — | — | — | ||||||||||||||||||||||||||||||||||||||||||||||||||||||||||||||
| Net income | — | — | — | — | — | — | — | — | |||||||||||||||||||||||||||||||||||||||||||||||||||||||||||||||
| Balance, September 28, 2024 | ( | ||||||||||||||||||||||||||||||||||||||||||||||||||||||||||||||||||||||
| Amortization of share-based awards | — | — | — | — | — | — | — | — | — | ||||||||||||||||||||||||||||||||||||||||||||||||||||||||||||||
| Restricted share activity | — | — | — | — | ( | — | — | ( | — | ( | |||||||||||||||||||||||||||||||||||||||||||||||||||||||||||||
| Issuance of common stock | — | — | — | — | — | — | — | ||||||||||||||||||||||||||||||||||||||||||||||||||||||||||||||||
| Distribution to noncontrolling interest | — | — | — | — | — | — | — | — | — | ( | ( | ||||||||||||||||||||||||||||||||||||||||||||||||||||||||||||
| Repurchase of stock | ( | ( | ( | ( | — | — | ( | ( | — | ( | — | ( | |||||||||||||||||||||||||||||||||||||||||||||||||||||||||||
| Other comprehensive loss | — | — | — | — | — | — | — | — | ( | ( | — | ( | |||||||||||||||||||||||||||||||||||||||||||||||||||||||||||
| Net income | — | — | — | — | — | — | — | — | |||||||||||||||||||||||||||||||||||||||||||||||||||||||||||||||
| Balance, September 27, 2025 | $ | $ | $ | $ | $ | $ | ( | $ | $ | $ | |||||||||||||||||||||||||||||||||||||||||||||||||||||||||||||
See notes to consolidated financial statements
F-9
CENTRAL GARDEN & PET COMPANY
CONSOLIDATED STATEMENTS OF CASH FLOWS
| Fiscal Year Ended | |||||||||||||||||
| September 27, 2025 | September 28, 2024 | September 30, 2023 | |||||||||||||||
| (in thousands) | |||||||||||||||||
| Cash flows from operating activities: | |||||||||||||||||
| Net income | $ | $ | $ | ||||||||||||||
| Adjustments to reconcile net income to net cash provided by operating activities: | |||||||||||||||||
| Depreciation and amortization | |||||||||||||||||
| Amortization of deferred financing costs | |||||||||||||||||
| Non-cash lease expense | |||||||||||||||||
| Stock-based compensation | |||||||||||||||||
| Gain on sale of business | ( | ||||||||||||||||
| Deferred income taxes | ( | ( | ( | ||||||||||||||
| Facility closures and business exit costs | |||||||||||||||||
| Impairment of intangibles | |||||||||||||||||
| Other asset impairments | |||||||||||||||||
| Other | ( | ||||||||||||||||
| Changes in assets and liabilities (excluding businesses acquired): | |||||||||||||||||
| Receivables | |||||||||||||||||
| Inventories | |||||||||||||||||
| Prepaid expenses and other assets | ( | ||||||||||||||||
| Accounts payable | ( | ||||||||||||||||
| Accrued expenses | |||||||||||||||||
| Other long-term obligations | ( | ||||||||||||||||
| Operating lease liabilities | ( | ( | ( | ||||||||||||||
| Net cash provided by operating activities | |||||||||||||||||
| Cash flows from investing activities: | |||||||||||||||||
| Additions to property, plant and equipment | ( | ( | ( | ||||||||||||||
| Business acquired, net of cash acquired | ( | ( | |||||||||||||||
| Proceeds from sale of business | |||||||||||||||||
| Payments for investments | ( | ( | |||||||||||||||
| Other investing activities | ( | ( | ( | ||||||||||||||
| Net cash used in investing activities | ( | ( | ( | ||||||||||||||
| Cash flows from financing activities: | |||||||||||||||||
| Repayments on revolving line of credit | ( | ||||||||||||||||
| Borrowings on revolving line of credit | |||||||||||||||||
| Repayments of long-term debt | ( | ( | ( | ||||||||||||||
| Proceeds from issuance of common stock, net of offering costs | |||||||||||||||||
| Repurchase of common stock, including shares surrendered for tax withholding | ( | ( | ( | ||||||||||||||
| Payments of contingent consideration | ( | ( | |||||||||||||||
| Distribution to noncontrolling interest | ( | ( | |||||||||||||||
| Net cash used in financing activities | ( | ( | ( | ||||||||||||||
| Effect of exchange rate changes on cash and equivalents | ( | ||||||||||||||||
| Net increase in cash, cash equivalents and restricted cash | |||||||||||||||||
| Cash, cash equivalents and restricted cash at beginning of year | |||||||||||||||||
| Cash, cash equivalents and restricted cash at end of year | $ | $ | $ | ||||||||||||||
| Supplemental information: | |||||||||||||||||
| Cash paid for interest | $ | $ | $ | ||||||||||||||
| Cash paid for income taxes – net of refunds | |||||||||||||||||
| Non-cash investing and financing activities: | |||||||||||||||||
| Capital expenditures incurred but not paid | |||||||||||||||||
| Liability for contingent performance based payments | ( | ( | |||||||||||||||
| Shares of common stock repurchased but not settled | |||||||||||||||||
| Lease liabilities arising from obtaining right-of-use assets | |||||||||||||||||
See notes to consolidated financial statements.
F-10
CENTRAL GARDEN & PET COMPANY
NOTES TO CONSOLIDATED FINANCIAL STATEMENTS
Fiscal Years Ended September 27, 2025,
September 28, 2024, and September 30, 2023
1.Organization and Significant Accounting Policies
Organization – Central Garden & Pet Company (“Central”), a Delaware corporation, and subsidiaries (the “Company”), is a leading marketer and producer of quality branded products and distributor of third-party products in the pet and lawn and garden supplies markets.
Basis of Consolidation and Presentation – The consolidated financial statements are prepared in conformity with accounting principles generally accepted in the United States of America (GAAP) and include the accounts of Central and all majority-owned subsidiaries. All intercompany balances and transactions have been eliminated in consolidation. The fiscal years ended September 27, 2025 and September 28, 2024 each included 52 weeks and the fiscal year ended September 30, 2023 included 53 weeks.
Revenue Recognition and Nature of Products and Services
The Company manufactures, markets and distributes a wide variety of branded, private label and third-party pet and garden products to wholesalers, distributors and retailers, primarily in the United States. The majority of the Company’s revenue is generated from the sale of finished pet and garden products. The Company also recognizes a minor amount of non-product revenue (approximately one percent of consolidated net sales) comprising third-party logistics services, merchandising services and royalty income from sales-based licensing arrangements. Product and non-product revenue is recognized when performance obligations under the terms of the contracts with customers are satisfied. The Company recognizes product revenue when control over the finished goods transfers to its customers, which generally occurs upon shipment to, or receipt at, customers’ locations, as determined by the specific terms of the contract, and when control over the finished goods transfers to retail consumers in consignment arrangements. These revenue arrangements generally have single performance obligations. Non-product revenue is recognized as the services are provided to the customer in the case of third-party logistics services and merchandising services, or as third-party licensee sales occur for royalty income. Revenue, which includes shipping and handling charges billed to the customer, is reported net of variable consideration and consideration payable to our customers, including applicable discounts, returns, allowances, trade promotion, unsaleable product, consumer coupon redemption and rebates. The amount billed to customers for shipping and handling costs included in net sales for the fiscal years ended September 27, 2025, September 28, 2024 and September 30, 2023 was $12.8 million, $12.8 million and $13.6 million, respectively. Shipping and handling costs that occur before the customer obtains control of the goods are deemed to be fulfillment activities and are accounted for as fulfillment costs.
Key sales terms are established on a frequent basis such that most customer arrangements and related incentives have a one year or shorter duration. As such, the Company does not capitalize contract inception costs. The Company generally does not have unbilled receivables at the end of a period. Deferred revenues are not material and primarily include advance payments for services that have yet to be rendered. The Company does not receive noncash consideration for the sale of goods. Amounts billed and due from our customers are classified as receivables and require payment on a short-term basis; therefore, the Company does not have any significant financing components.
F-11
CENTRAL GARDEN & PET COMPANY
NOTES TO CONSOLIDATED FINANCIAL STATEMENTS (Continued)
Sales Incentives and Other Promotional Programs
The Company routinely offers sales incentives and discounts through various regional and national programs to its customers and consumers. These programs include product discounts or allowances, product rebates, product returns, one-time or ongoing trade-promotion programs with customers and consumer coupon programs that require the Company to estimate and accrue the expected costs of such programs. The costs associated with these activities are accounted for as reductions to the transaction price of the Company’s products and are, therefore, recorded as reductions to gross sales at the time of sale. The Company bases its estimates of incentive costs on historical trend experience with similar programs, actual incentive terms per customer contractual obligations and expected levels of performance of trade promotions, utilizing customer and sales organization inputs. The Company maintains liabilities at the end of each period for the estimated incentive costs incurred but unpaid for these programs. Differences between estimated and actual incentive costs have not been material and are recognized in earnings in the period such differences are determined. Reserves for product returns, accrued rebates and promotional accruals are included in the consolidated balance sheets as part of accrued expenses, and the value of inventory associated with reserves for sales returns is included within prepaid and other current assets on the consolidated balance sheets.
401(k) Plans – The Company sponsors several 401(k) plans which cover substantially all employees. The Company’s matching contributions expensed under these plans were $7.7 million for fiscal 2025, $6.8 million for fiscal 2024 and $7.9 million for fiscal 2023. In fiscal 2025, 2024 and 2023, the Company’s matching contributions made in the Company’s Class A common stock resulted in the issuance of approximately 240,328 , 198,697 and 216,000 shares, respectively.
Other income (expense) consists principally of earnings (losses) from equity method investments and foreign exchange gains and losses.
| September 27, 2025 | September 28, 2024 | September 30, 2023 | |||||||||||||||
| (in thousands) | |||||||||||||||||
| Cash and cash equivalents | $ | $ | $ | ||||||||||||||
| Restricted cash | |||||||||||||||||
| Total cash, cash equivalents and restricted cash | $ | $ | $ | ||||||||||||||
Accounts receivable are carried at their estimated net realizable value. Trade credit is generally extended on a short-term basis; thus trade receivables do not bear interest, although a finance charge may be applied to such receivables that are past due.
Allowance for Credit Losses and Customer Allowances – The Company’s trade accounts receivable are recorded at net realizable value, which includes an allowance for estimated credit losses, as well as allowances for contractual customer deductions accounted for as variable consideration.
F-12
CENTRAL GARDEN & PET COMPANY
NOTES TO CONSOLIDATED FINANCIAL STATEMENTS (Continued)
Leases -The Company determines whether an arrangement contains a lease at inception by determining if the contract conveys the right to control the use of identified property, plant or equipment for a period of time in exchange for consideration and other facts and circumstances. Long-term operating lease right-of-use ("ROU") assets and current and long-term operating lease liabilities are presented separately in the consolidated balance sheets. Finance lease ROU assets are presented in property, plant and equipment, net, and the related finance liabilities are presented with current and long-term debt in the consolidated balance sheets.
Lease ROU assets represent the Company's right to use an underlying asset for the lease term, and lease liabilities represent the Company's obligation to make lease payments arising from the lease. ROU assets are calculated based on the lease liability adjusted for any lease payments paid to the lessor at or before the commencement date and excludes any lease incentives received from the lessor. Lease liabilities are recognized based on the present value of the future minimum lease payments over the lease term. The lease term may include options to extend or terminate the lease when it is reasonably certain that the Company will exercise that option. As the Company's leases typically do not contain a readily determinable implicit rate, the Company determines the present value of the lease liability using its incremental borrowing rate at the lease commencement date based on the lease term on a collateralized basis. Variable lease payments are expensed as incurred and include certain non-lease components, such as maintenance and other services provided by the lessor, and other charges included in the lease, as applicable. Non-lease components and the lease components to which they relate are accounted for as a single lease component, as the Company has elected to combine lease and non-lease components for all classes of underlying assets.
F-13
CENTRAL GARDEN & PET COMPANY
NOTES TO CONSOLIDATED FINANCIAL STATEMENTS (Continued)
Insurance – The Company maintains insurance for certain risks, including workers’ compensation, general liability and automobile liability, and is self-insured for employee related health care benefits. The Company’s workers’ compensation, general liability and automobile liability insurance policies include deductibles of $250,000 to $500,000 per occurrence. The Company maintains excess loss insurance that covers any health care claims in excess of $1,000,000 per person per year. The Company establishes reserves for losses based on its claims experience and actuarial estimates of the ultimate loss amount inherent in the claims, including claims incurred but not yet reported. Costs are recognized in the period the claim is incurred, and the financial statement accruals include an estimate of claims incurred but not yet reported.
Recent Accounting Pronouncements
Recently Adopted Accounting Standards
Segment Reporting
In November 2023, the FASB issued Accounting Standards Update (“ASU”) 2023-07, Segment Reporting (Topic 280) Improvements to Reportable Segment Disclosures. ASU 2023-07 will improve reportable segment disclosure requirements, primarily through enhanced disclosures about significant segment expenses on an interim and annual basis. This ASU requires entities to provide significant segment expenses that are regularly provided to the chief operating decision maker (“CODM”), other segment expenses included in each reported measure of segment profitability, and disclosure of the title and position of the CODM. During 2025, we adopted the annual disclosure requirements on a retrospective basis. The additional disclosures required are presented in Note 18 - Business Segment Data. The adoption of this standard did not have a material impact on our consolidated financial statements.
Accounting Standards Not Yet Adopted
Income Taxes
In December 2023, the FASB issued ASU No. 2023-09, Income Taxes (Topic 740): Improvements to Income Tax Disclosures. This ASU primarily requires enhanced disclosures and disaggregation of income tax information by jurisdiction in the annual income tax reconciliation and quantitative and qualitative disclosures regarding income taxes paid. ASU No. 2023-09 is to be applied prospectively, with the option to apply the standard retrospectively, effective for fiscal years beginning after December 15, 2024. The Company is currently evaluating the impact that the adoption of this guidance will have on the Company’s disclosures.
2.Fair Value Measurements
Generally accepted accounting principles require financial assets and liabilities to be categorized based on the inputs used to calculate their fair values as follows:
Level 1 – Quoted prices in active markets for identical assets or liabilities.
Level 2 – Inputs other than quoted prices included within Level 1 that are observable for the asset or liability, either directly or indirectly.
Level 3 – Unobservable inputs for the asset or liability, which reflect the Company’s own assumptions about the assumptions that market participants would use in pricing the asset or liability (including assumptions about risk).
F-14
CENTRAL GARDEN & PET COMPANY
NOTES TO CONSOLIDATED FINANCIAL STATEMENTS (Continued)
The Company’s financial instruments include cash and equivalents, restricted cash and equivalents, accounts receivable and payable and accrued liabilities. The carrying amount of these instruments approximates fair value because of their short-term nature.
Assets and Liabilities Measured at Fair Value on a Recurring Basis
The fair values of the Company's contingent consideration liabilities from previous business acquisitions are considered "Level 3" measurements because the Company uses various estimates in the valuation models to project timing and amount of future contingent payments. The liability for contingent consideration relates to future performance-based contingent payments. The performance period extends through fiscal 2028. The fair value of the estimated contingent consideration arrangement is determined based on the Company’s evaluation as to the probability and amount of any earn-out that will be achieved based on expected future performance by the acquired entity. The balance, if there is an amount, is presented as part of long-term liabilities in the Company's consolidated balance sheets.
The following table provides a summary of changes in fair value of the Company's Level 3 financial instruments for the years ended September 27, 2025 and September 28, 2024:
| Amount | |||||
| (in thousands) | |||||
Balance September 30, 2023 | $ | ||||
| Changes in the fair value of contingent performance-based payments | ( | ||||
| Performance-based payments made | ( | ||||
| Balance September 28, 2024 | |||||
| Estimated contingent performance-based consideration established at the time of acquisition | |||||
| Changes in the fair value of contingent performance-based payments | |||||
| Performance-based payments made | |||||
| Balance September 27, 2025 | $ | ||||
Assets and Liabilities Measured at Fair Value on a Non-Recurring Basis
The Company measures certain non-financial assets and liabilities, including long-lived assets, goodwill, intangible assets and right-of-use assets at fair value on a non-recurring basis. Fair value measurements of non-financial assets and non-financial liabilities are used primarily in the impairment analyses of long-lived assets, goodwill and other intangible assets. In fiscal year ended September 27, 2025, impairment charges of approximately $1.0 million in the Company's Pet segment was recorded as part of selling, general and administrative expenses in the consolidated statements of operations. In fiscal year ended September 28, 2024, impairment charges of approximately $12.8 million in the Company's Pet segment was recorded as part of selling, general and administrative expenses in the consolidated statements of operations. In fiscal year ended September 30, 2023, impairment charges of approximately $7.5 million and $3.9 million in the Company's Pet and Garden segments, respectively, were recorded as part of selling, general and administrative expenses in the consolidated statements of operations.
Fair Value of Other Financial Instruments
In April 2021, the Company issued $400 million aggregate principal amount of 4.125 % senior notes due April 2031 (the "2031 Notes"). The estimated fair value of the Company's 2031 Notes as of September 27, 2025 and September 28, 2024 was $374.4 million and $367.2 million compared to a carrying value of $396.7 million and $396.0 million, respectively.
In October 2020, the Company issued $500 million aggregate principal amount of 4.125 % senior notes due October 2030 (the "2030 Notes"). The estimated fair value of the Company's 2030 Notes as of September 27, 2025 and September 28, 2024 was $473.5 million and $465.2 million compared to a carrying value of $496.0 million and $495.2 million, respectively.
In December 2017, the Company issued $300 million aggregate principal amount of 5.125 % senior notes due February 2028 (the "2028 Notes"). The estimated fair value of the Company's 2028 Notes as of September 27, 2025 and September 28, 2024 was $299.4 million and $299.2 million, respectively, compared to a carrying value of $298.9 million and $298.4 million, respectively.
The estimated fair value is based on quoted market prices for these notes, which are Level 2 inputs within the fair value hierarchy.
F-15
CENTRAL GARDEN & PET COMPANY
NOTES TO CONSOLIDATED FINANCIAL STATEMENTS (Continued)
3.Acquisitions, Divestitures and Investments
Fiscal 2025
The Company did not make any material acquisitions in fiscal 2025.
Fiscal 2024
On November 3, 2023, the Company acquired TDBBS, LLC (“TDBBS”), a provider of premium natural dog chews and treats for approximately $60 million. The addition of TDBBS expands Central’s portfolio with bully and collagen sticks, bones and jerky, adds scale to its dog and cat business and enhances Central’s eCommerce and direct-to-consumer capabilities. The purchase price exceeded the estimated fair value of the net tangible assets acquired by approximately $45 million, of which $23 million was allocated to identified intangible assets and approximately $5 million was included in goodwill. Financial results of TDBBS have been included in the results of operations within the Pet segment since the date of acquisition. The following table summarizes the purchase price and recording of fair values of the assets acquired and liabilities assumed as of the acquisition date and subsequent adjustments.
| Amounts Previously Recognized as of Acquisition Date (1) | Measurement Period Adjustments | Amounts Recognized as of Acquisition Date (as Adjusted) | |||||||||||||||
| (in thousands) | |||||||||||||||||
| Current assets, net of cash and cash equivalents acquired | $ | $ | $ | ||||||||||||||
| Fixed assets | |||||||||||||||||
| Goodwill | |||||||||||||||||
| Other assets | ( | ||||||||||||||||
| Operating lease right-of-use assets | |||||||||||||||||
| Deferred tax assets | |||||||||||||||||
| Other intangible assets, net | |||||||||||||||||
| Current liabilities | ( | ( | |||||||||||||||
| Long-term lease liabilities | ( | ( | |||||||||||||||
| Net assets acquired, less cash and cash equivalents | $ | $ | $ | ||||||||||||||
(1) As previously reported in the Company's Form 10-Q for the period ended June 29, 2024. The impact to the consolidated statement of operations associated with the finalization of purchase accounting and true-up of intangible assets for TDBBS was immaterial. Proforma financial information has not been presented as the TDBBS acquisition was not considered material to the Company's overall consolidated financial statements during the periods presented.
Fiscal 2023
The Company did not make any acquisitions in fiscal 2023.
Divestiture
Sale of Garden Segment Independent Distribution Business
In the fourth quarter of fiscal 2023, the Company sold its independent garden center distribution business for approximately $20 million for inventory and the related customer data. Associated with the sale, the Company closed one facility and part of another facility due to excess space previously dedicated to serving the independent garden channel. As a result of these closures, the Company recorded a gain of $5.8 million which is net of the inventory sold, inventory transport costs and the associated facility closure costs, including severance. The gain was recorded as part of selling, general and administrative expenses.
Investments
During fiscal year 2025, the Company did not record any new investments or impairments. During fiscal 2024, the Company recorded an investment impairment totaling $7.5 million for two related private company investments. During fiscal 2023, the Company converted a SAFE note totaling $0.9 million into shares, acquiring a 6 % interest, which is accounted for in accordance with ASC 321.
F-16
CENTRAL GARDEN & PET COMPANY
NOTES TO CONSOLIDATED FINANCIAL STATEMENTS (Continued)
4.Concentration of Credit Risk and Significant Customers and Suppliers
Customer Concentration – Approximately 54 % of the Company’s net sales for fiscal 2025, 54 % for fiscal 2024 and 52 % for fiscal 2023 were derived from sales to the Company’s top five customers. The Company’s largest customer (which has sales in both Garden and Pet in fiscal 2025), accounted for approximately 17 16 % in 2023. The Company’s second largest customer (which has sales in Garden in 2025), accounted for approximately 16 9 % of the Company’s net sales in fiscal 2025, and 8 56 % and 53 %, respectively, of the Company’s total accounts receivable, including 19 % and 14 %, respectively, from the Company’s largest customer.
5.Allowance for Credit Losses and Customer Allowances
The Company’s trade accounts receivable are recorded at net realizable value, which includes an allowance for estimated credit losses, as well as an allowance for contractual customer deductions accounted for as variable consideration as described in Note 1 - Organization and Significant Accounting Policies.
The Company maintains an allowance for credit losses related to its trade accounts receivable for future expected credit losses resulting from the inability of its customers to make required payments. The Company estimates the allowance based upon historical bad debts, current customer receivable balances and the customer’s financial condition. The allowance is adjusted to reflect differences in current conditions as well as changes in forecasted macroeconomic conditions. The Company’s estimate of credit losses includes expected current and future economic and market conditions.
The following provides a reconciliation of the activity in the Allowance for Credit Losses and Customer Allowances:
| Balances at Beginning of Period | Charged/ (Credited) to Costs and Expenses | Asset Write-Offs, Less Recoveries | Increase/(Decrease) to Contractual Customer Deductions | Balances at End of Period | |||||||||||||||||||||||||
| (in thousands) | |||||||||||||||||||||||||||||
| Allowance for estimated credit losses | $ | $ | $ | ( | $ | $ | |||||||||||||||||||||||
| Allowance for contractual customer deductions | |||||||||||||||||||||||||||||
| Fiscal Year Ended September 30, 2023 | $ | $ | $ | ( | $ | $ | |||||||||||||||||||||||
| Allowance for estimated credit losses | ( | ||||||||||||||||||||||||||||
| Allowance for contractual customer deductions | ( | ||||||||||||||||||||||||||||
| Fiscal Year Ended September 28, 2024 | $ | $ | $ | ( | $ | ( | $ | ||||||||||||||||||||||
| Allowance for estimated credit losses | ( | ||||||||||||||||||||||||||||
| Allowance for contractual customer deductions | ( | ||||||||||||||||||||||||||||
| Fiscal Year Ended September 27, 2025 | $ | $ | $ | ( | $ | ( | $ | ||||||||||||||||||||||
F-17
CENTRAL GARDEN & PET COMPANY
NOTES TO CONSOLIDATED FINANCIAL STATEMENTS (Continued)
6.Inventories, net
Inventories, net of allowance for obsolescence, consist of the following:
| September 27, 2025 | September 28, 2024 | ||||||||||
| (in thousands) | |||||||||||
| Raw materials | $ | $ | |||||||||
| Work in progress | |||||||||||
| Finished goods | |||||||||||
| Supplies | |||||||||||
| Total inventories, net | $ | $ | |||||||||
7.Property and Equipment, net
Property and equipment, net consists of the following:
| September 27, 2025 | September 28, 2024 | |||||||||||||
| (in thousands) | ||||||||||||||
| Land | $ | $ | ||||||||||||
| Buildings and improvements | ||||||||||||||
| Transportation equipment | ||||||||||||||
| Machine and warehouse equipment | ||||||||||||||
| Capitalized software | ||||||||||||||
| Office furniture and equipment | ||||||||||||||
| Assets under construction | ||||||||||||||
| Accumulated depreciation and amortization | ( | ( | ||||||||||||
| Total property and equipment, net | $ | $ | ||||||||||||
Depreciation and amortization expense, including the amortization of intangible assets, charged to operations was $84.9 million, $90.8 million and $87.7 million for fiscal 2025, 2024 and 2023, respectively.
F-18
CENTRAL GARDEN & PET COMPANY
NOTES TO CONSOLIDATED FINANCIAL STATEMENTS (Continued)
8.Goodwill
Changes in the carrying amount of goodwill for the fiscal years ended September 27, 2025, September 28, 2024 and September 30, 2023:
| Garden Products Segment | Pet Products Segment | Total | |||||||||||||||
| (in thousands) | |||||||||||||||||
| Balance as of September 24, 2022 | |||||||||||||||||
| Goodwill | $ | $ | $ | ||||||||||||||
| Accumulated impairment losses | ( | ( | ( | ||||||||||||||
| Additions in fiscal 2023 | |||||||||||||||||
| Balance as of September 30, 2023 | |||||||||||||||||
| Goodwill | |||||||||||||||||
| Accumulated impairment losses | ( | ( | ( | ||||||||||||||
| Additions in fiscal 2024 | |||||||||||||||||
| Balance as of September 28, 2024 | |||||||||||||||||
| Goodwill | |||||||||||||||||
| Accumulated impairment losses | ( | ( | ( | ||||||||||||||
| Additions in fiscal 2025 | |||||||||||||||||
| Balance as of September 27, 2025 | |||||||||||||||||
| Goodwill | |||||||||||||||||
| Accumulated impairment losses | ( | ( | ( | ||||||||||||||
| $ | $ | $ | |||||||||||||||
Additions or reductions to goodwill include acquisitions, sale of businesses, purchase price adjustments and adjustments of amounts upon finalization of purchase accounting.
The Company tests goodwill for impairment annually (as of the first day of the fourth fiscal quarter), or whenever events occur or circumstances change that would more likely than not reduce the fair value of a reporting unit below its carrying amount, by first assessing qualitative factors to determine whether it is more likely than not the fair value of the reporting unit is less than its carrying amount. The qualitative assessment evaluates factors including macro-economic conditions, industry-specific and company-specific considerations, legal and regulatory environments and historical performance. If it is determined that it is more likely than not the fair value of the reporting unit is greater than its carrying amount, it is unnecessary to perform the quantitative goodwill impairment test. If it is determined that it is more likely than not that the fair value of the reporting unit is less than its carrying amount, the quantitative test is performed to identify potential goodwill impairment. Based on certain circumstances, the Company may elect to bypass the qualitative assessment and proceed directly to performing the quantitative goodwill impairment test, which compares the estimated fair value of our reporting units to their related carrying values, including goodwill. Impairment is indicated if the estimated fair value of the reporting unit is less than its carrying value, and an impairment charge is recognized for the differential. The Company’s goodwill impairment analysis also includes a comparison of the aggregate estimated fair value of its two reporting units to the Company’s total market capitalization.
Determining the fair value of a reporting unit involves the use of significant estimates and assumptions. The estimate of fair value of each of the Company’s reporting units is based on the Company’s projection of revenues, gross margin, operating costs and cash flows considering historical and estimated future results, general economic and market conditions as well as the impact of planned business and operational strategies. The Company bases its fair value estimates on assumptions the Company believes to be reasonable at the time, but such assumptions are subject to inherent uncertainty. Assumptions critical to the Company’s fair value estimates were: (i) discount rates used in determining the fair value of the reporting units; (ii) estimated future cash flows; and (iii) projected revenue and operating profit growth rates used in the reporting unit models. Actual results may differ from those estimates. The valuations employ present value techniques to measure fair value and consider market factors.
In connection with the Company's annual goodwill impairment testing performed during fiscal 2025, the Company made a qualitative evaluation about the likelihood of goodwill impairment to determine whether it was necessary to calculate the fair values of its reporting units under the goodwill impairment test. The Company completed its qualitative assessment of potential goodwill impairment and determined that
F-19
CENTRAL GARDEN & PET COMPANY
NOTES TO CONSOLIDATED FINANCIAL STATEMENTS (Continued)
it was more likely than not the fair values of the Company's reporting units were greater than their carrying amount in fiscal 2025, and accordingly, no further testing of goodwill was required in fiscal 2025.
In connection with the Company’s annual goodwill impairment testing performed during fiscal 2024, the Company made a qualitative evaluation about the likelihood of goodwill impairment to determine whether it was necessary to calculate the fair values of its reporting segments under the goodwill impairment test. The Company completed our qualitative assessment of potential goodwill impairment and determined that it was more likely than not the fair values of the Company’s reporting segments were greater than their carrying amount in fiscal 2024, and accordingly, no further testing of goodwill was required in fiscal 2024.
9.Other Intangible Assets
The following table summarizes the components of gross and net acquired intangible assets:
| Gross | Accumulated Amortization | Accumulated Impairment | Net Carrying Value | ||||||||||||||||||||
| (in millions) | |||||||||||||||||||||||
| September 27, 2025 | |||||||||||||||||||||||
| Marketing-related intangible assets – amortizable | $ | $ | ( | $ | $ | ||||||||||||||||||
| Marketing-related intangible assets – nonamortizable | ( | ||||||||||||||||||||||
| Total | ( | ( | |||||||||||||||||||||
| Customer-related intangible assets – amortizable | ( | ( | |||||||||||||||||||||
| Other acquired intangible assets – amortizable | ( | ( | |||||||||||||||||||||
| Other acquired intangible assets – nonamortizable | ( | ||||||||||||||||||||||
| Total | ( | ( | |||||||||||||||||||||
| Total other intangible assets | $ | $ | ( | $ | ( | $ | |||||||||||||||||
| September 28, 2024 | |||||||||||||||||||||||
| Marketing-related intangible assets – amortizable | $ | $ | ( | $ | $ | ||||||||||||||||||
| Marketing-related intangible assets – nonamortizable | ( | ||||||||||||||||||||||
| Total | ( | ( | |||||||||||||||||||||
| Customer-related intangible assets – amortizable | ( | ( | |||||||||||||||||||||
| Other acquired intangible assets – amortizable | ( | ( | |||||||||||||||||||||
| Other acquired intangible assets – nonamortizable | ( | ||||||||||||||||||||||
| Total | ( | ( | |||||||||||||||||||||
| Total other intangible assets | $ | $ | ( | $ | ( | $ | |||||||||||||||||
| September 30, 2023 | |||||||||||||||||||||||
| Marketing-related intangible assets – amortizable | $ | $ | ( | $ | $ | ||||||||||||||||||
| Marketing-related intangible assets – nonamortizable | ( | ||||||||||||||||||||||
| Total | ( | ( | |||||||||||||||||||||
| Customer-related intangible assets – amortizable | ( | ( | |||||||||||||||||||||
| Other acquired intangible assets – amortizable | ( | ( | |||||||||||||||||||||
| Other acquired intangible assets – nonamortizable | ( | ||||||||||||||||||||||
| Total | ( | ( | |||||||||||||||||||||
| Total other intangible assets | $ | $ | ( | $ | ( | $ | |||||||||||||||||
Other acquired intangible assets include contract-based and technology-based intangible assets.
F-20
CENTRAL GARDEN & PET COMPANY
NOTES TO CONSOLIDATED FINANCIAL STATEMENTS (Continued)
As part of its acquisition of TDBBS in fiscal 2024, the Company acquired approximately $17.7 million of marketing-related intangible assets and $5.3 million of customer-related intangible assets. See Note 3 – Acquisitions.
The Company evaluates long-lived assets, including amortizable and indefinite-lived intangible assets, for impairment whenever events or changes in circumstances indicate the carrying value may not be recoverable. The Company evaluates indefinite-lived intangible assets on an annual basis. As a result of market changes and declining sales, factors indicating the carrying value of certain amortizable and indefinite-lived intangible assets may not be recoverable were present in fiscal 2025, 2024 and 2023. The Company performed impairment testing on these assets, found the carrying value was not recoverable, and accordingly, recorded impairment charges of approximately $1.0 million in its Pet segment as part of selling, general and administrative expenses in the consolidated statements of operations for the fiscal year ended September 27, 2025, $12.8 million in its Pet segment as part of selling, general and administrative expenses in the consolidated statements of operations for the fiscal year ended September 28, 2024, and $7.5 million and $3.9 million in its Pet and Garden segments, respectively, as part of selling, general and administrative expenses in the consolidated statements of operations for the fiscal year ended September 30, 2023.
The Company is currently amortizing its acquired intangible assets with definite lives over periods ranging from five years to 25 years; over weighted-average remaining lives of eight years for marketing-related intangibles, ten years for customer-related intangibles and seven years for other acquired intangibles. Amortization expense for intangibles subject to amortization was approximately $27.0 million, $34.1 million and $34.5 million, for fiscal 2025, 2024 and 2023, respectively, and is classified within selling, general and administrative expenses in the consolidated statements of operations. Annual amortization expense related to acquired intangible assets in each of the succeeding five years is estimated to be approximately $24 22
F-21
CENTRAL GARDEN & PET COMPANY
NOTES TO CONSOLIDATED FINANCIAL STATEMENTS (Continued)
10.Leases
The Company has operating and finance leases for manufacturing and distribution facilities, vehicles, equipment and office space. The Company's leases have remaining lease terms of to 10 years, inclusive of renewal or termination options that the Company is reasonably certain to exercise. The Company does not include significant restrictions or covenants in its lease agreements, and residual value guarantees are not included within its operating leases. Some of the Company's leasing arrangements require variable payments that are dependent on usage or output or may vary for other reasons, such as product costs, insurance and tax payments. These variable payments are not included in the Company's recorded lease assets and liabilities and are expensed as incurred. Certain leases are tied to a variable index or rate and are included in lease assets and liabilities based on the indices or rates as of lease commencement. See Note 1 – Organization and Significant Accounting Policies, for more information about the Company's lease accounting policies.
Supplemental balance sheet information related to the Company's leases was as follows:
| Balance Sheet Classification | September 27, 2025 | September 28, 2024 | |||||||||||||||
| (in millions) | |||||||||||||||||
| Operating leases | |||||||||||||||||
| Right-of-use assets | Operating lease right-of-use assets | $ | $ | ||||||||||||||
| Current lease liabilities | Current operating lease liabilities | $ | $ | ||||||||||||||
| Non-current lease liabilities | Long-term operating lease liabilities | ||||||||||||||||
| Total operating lease liabilities | $ | $ | |||||||||||||||
| Finance leases | |||||||||||||||||
| Right-of-use assets | $ | $ | |||||||||||||||
| Current lease liabilities | $ | $ | |||||||||||||||
| Non-current lease liabilities | |||||||||||||||||
| Total finance lease liabilities | $ | $ | |||||||||||||||
Components of lease cost were as follows:
| Fiscal Year Ended | |||||||||||
| September 27, 2025 | September 28, 2024 | ||||||||||
| (in millions) | |||||||||||
| Operating lease cost | $ | $ | |||||||||
| Finance lease cost: | |||||||||||
| Amortization of right-of-use assets | $ | $ | |||||||||
| Interest on lease liabilities | |||||||||||
| Total finance lease cost | $ | $ | |||||||||
| Short-term lease cost | $ | $ | |||||||||
| Variable lease cost | $ | $ | |||||||||
| Total lease cost | $ | $ | |||||||||
F-22
CENTRAL GARDEN & PET COMPANY
NOTES TO CONSOLIDATED FINANCIAL STATEMENTS (Continued)
Supplemental cash flow information and non-cash activity related to the Company's leases was as follows:
| Fiscal Year Ended | |||||||||||||||||
| September 27, 2025 | September 28, 2024 | ||||||||||||||||
| (in millions) | |||||||||||||||||
| Cash paid for amounts included in the measurement of lease liabilities: | |||||||||||||||||
| Operating cash flows from operating leases | $ | $ | |||||||||||||||
| Operating cash flows from finance leases | |||||||||||||||||
| Financing cash flows from finance leases | |||||||||||||||||
| Right-of-use assets obtained in exchange for lease obligations: | |||||||||||||||||
| Operating leases | $ | $ | |||||||||||||||
| Finance leases | |||||||||||||||||
Weighted-average remaining lease term and discount rate for the Company's leases were as follows:
| September 27, 2025 | September 28, 2024 | |||||||||||||
| Weighted-average remaining lease term (in years): | ||||||||||||||
| Operating leases | ||||||||||||||
| Finance leases | ||||||||||||||
| Weighted-average discount rate: | ||||||||||||||
| Operating leases | % | % | ||||||||||||
| Finance leases | % | % | ||||||||||||
Lease liability maturities as of September 27, 2025 are as follows:
| September 27, 2025 | ||||||||||||||
| Operating Leases | Finance Leases | |||||||||||||
| Fiscal Year | (in millions) | |||||||||||||
| 2026 | $ | $ | ||||||||||||
| 2027 | ||||||||||||||
| 2028 | ||||||||||||||
| 2029 | ||||||||||||||
| 2030 | ||||||||||||||
| Thereafter | ||||||||||||||
| Total future undiscounted lease payments | $ | $ | ||||||||||||
| Less imputed interest | ( | |||||||||||||
| Total reported lease liability | $ | $ | ||||||||||||
F-23
CENTRAL GARDEN & PET COMPANY
NOTES TO CONSOLIDATED FINANCIAL STATEMENTS (Continued)
11.Long-Term Debt
Long-term debt consists of the following:
| September 27, 2025 | September 28, 2024 | ||||||||||||||||
| (in thousands) | |||||||||||||||||
Senior notes, interest at | $ | $ | |||||||||||||||
Senior notes, interest at | |||||||||||||||||
Senior notes, interest at | |||||||||||||||||
| Unamortized debt issuance costs | ( | ( | |||||||||||||||
| Net carrying value | |||||||||||||||||
Asset-based revolving credit facility, interest at SOFR plus a margin of | |||||||||||||||||
| Other notes payable | |||||||||||||||||
| Total | |||||||||||||||||
| Less current portion | ( | ( | |||||||||||||||
| Long-term portion | $ | $ | |||||||||||||||
Senior Notes
$400 million 4.125 % Senior Notes due 2031
In April 2021, the Company issued $400 million aggregate principal amount of 4.125 % senior notes due April 2031 (the "2031 Notes"). The Company used a portion of the net proceeds from the offering to repay all outstanding borrowings under its Credit Facility, with the remainder used for general corporate purposes.
The Company incurred approximately $6 million of debt issuance costs in conjunction with this issuance, which included underwriter fees and legal, accounting and rating agency expenses. The debt issuance costs are being amortized over the term of the 2031 Notes.
The 2031 Notes require semi-annual interest payments on April 30 and October 30. The 2031 Notes are unconditionally guaranteed on a senior basis by each of the Company's existing and future domestic restricted subsidiaries which are borrowers under or guarantors of the Company's Credit Facility. The 2031 Notes were issued in a private placement under Rule 144A and will not be registered under the Securities Act of 1933.
The Company may redeem some or all of the 2031 Notes at any time, at its option, prior to April 30, 2026 at the principal amount plus a "make whole" premium. The Company may redeem some or all of the 2031 Notes at the Company's option, at any time on or after April 30, 2026 for 102.063 %, on or after April 30, 2027 for 101.375 %, on or after April 30, 2028 for 100.688 % and on or after April 30, 2029 for 100.0 %, plus accrued and unpaid interest.
The holders of the 2031 Notes have the right to require the Company to repurchase all or a portion of the 2031 Notes at a purchase price equal to 101 % of the principal amount of the notes repurchased, plus accrued and unpaid interest, upon the occurrence of a change of control.
The 2031 Notes contain customary high yield covenants, including covenants limiting debt incurrence and restricted payments, subject to certain baskets and exceptions. The Company was in compliance with all financial covenants as of September 27, 2025.
$500 million 4.125 % Senior Notes due 2030
In October 2020, the Company issued $500 million aggregate principal amount of 4.125 % senior notes due October 2030 (the "2030 Notes"). The Company used a portion of the net proceeds to redeem all of its outstanding 6.125 % senior notes due November 2023 (the "2023 Notes") at a redemption price of 101.531 % plus accrued and unpaid interest, and to pay related fees and expenses, with the remainder used for general corporate purposes.
The Company incurred approximately $8.0 million of debt issuance costs associated with this transaction, which included underwriter fees and legal, accounting and rating agency expenses. The debt issuance costs are being amortized over the term of the 2030 Notes.
The 2030 Notes require semiannual interest payments on October 15 and April 15. The 2030 Notes are unconditionally guaranteed on a senior basis by each of the Company's existing and future domestic restricted subsidiaries which are borrowers under or guarantors of the Company's Credit Facility.
F-24
CENTRAL GARDEN & PET COMPANY
NOTES TO CONSOLIDATED FINANCIAL STATEMENTS (Continued)
The Company may redeem some or all of the 2030 Notes, at its option, in whole or in part, at any time on or after October 15, 2025 for 102.063 %, on or after October 15, 2026 for 101.375 %, on or after October 15, 2027 for 100.688 % and on or after October 15, 2028 for 100.0 %, plus accrued and unpaid interest.
The holders of the 2030 Notes have the right to require the Company to repurchase all or a portion of the 2030 Notes at a purchase price equal to 101.0 % of the principal amount of the notes repurchased, plus accrued and unpaid interest upon the occurrence of a change of control.
The 2030 Notes contain customary high yield covenants, including covenants limiting debt incurrence and restricted payments, subject to certain baskets and exceptions. The Company was in compliance with all financial covenants as of September 27, 2025.
$300 million 5.125 % Senior Notes due 2028
In December 2017, the Company issued $300 million aggregate principal amount of 5.125 % senior notes due February 2028 (the "2028 Notes"). The Company used the net proceeds from the offering to finance acquisitions and for general corporate purposes.
The Company incurred approximately $4.8 million of debt issuance costs in conjunction with this transaction, which included underwriter fees and legal, accounting and rating agency expenses. The debt issuance costs are being amortized over the term of the 2028 Notes.
The 2028 Notes require semiannual interest payments on February 1 and August 1. The 2028 Notes are unconditionally guaranteed on a senior basis by the Company's existing and future domestic restricted subsidiaries which are borrowers under or guarantors of the Company's Credit Facility.
The Company may redeem some or all of the 2028 Notes, at its option, at any time through December 31, 2025, for 100.854 %, and on or after January 1, 2026 for 100.0 %, plus accrued and unpaid interest.
The holders of the 2028 Notes have the right to require the Company to repurchase all or a portion of the 2028 Notes at a purchase price equal to 101.0 % of the principal amount of the notes repurchased, plus accrued and unpaid interest upon the occurrence of a change of control.
The 2028 Notes contain customary high yield covenants, including covenants limiting debt incurrence and restricted payments, subject to certain baskets and exceptions. The Company was in compliance with all financial covenants as of September 27, 2025.
Asset-Based Loan Facility
On December 16, 2021, the Company entered into a Third Amended and Restated Credit Agreement (“Credit Agreement”). The Credit Agreement provides for a $750 million principal amount senior secured asset-based revolving credit facility, with up to an additional $400 million principal amount available with the consent of the Lenders, as defined, if the Company exercises the uncommitted accordion feature set forth therein (collectively, the “Credit Facility”). The Credit Facility matures on December 16, 2026. The Company may borrow, repay and reborrow amounts under the Credit Facility until its maturity date, at which time all amounts outstanding under the Credit Facility must be repaid in full.
The Credit Facility is subject to a borrowing base that is calculated using a formula based upon eligible receivables and inventory, and at the Company's election, eligible real property, minus certain reserves. Proceeds of the Credit Facility will be used for general corporate purposes. Net availability under the Credit Facility was approximately $472 million as of September 27, 2025. The Credit Facility includes a $50 million sublimit for the issuance of commercial and standby letters of credit and a $75 million sublimit for swing loan borrowings. As of September 27, 2025, there were no borrowings outstanding and no letters of credit outstanding under the Credit Facility. Outside of the Credit Facility, there were other standby and commercial letters of credit of $3.0 million outstanding as of September 27, 2025.
Borrowings under the Credit Facility bear interest at a rate based on SOFR (which will not be less than 0.00 %) or, at the option of the Company, the Base Rate, plus, in either case, an applicable margin based on the Company's usage under the Credit Facility. Base Rate is defined as the highest of (a) the Truist Bank prime rate, (b) the Federal Funds Rate plus 0.50 %, (c) one-month SOFR plus 1.00 % and (d) 0.00 %. The applicable margin for SOFR-based borrowings fluctuates between 1.00 %-1.50 %, and was 1.00 % as of September 27, 2025, and the applicable margin for Base Rate borrowings fluctuates between 0.00 %-0.50 %, and was 0.00 % as of September 27, 2025. An unused line fee shall be payable quarterly in respect of the total amount of the unutilized Lenders’ commitments and short-notice borrowings under the Credit Facility. Standby letter of credit fees at the applicable margin on the average undrawn and unreimbursed amount of standby letters of credit are payable quarterly, and a facing fee of 0.125 % is payable quarterly for the stated amount of each letter of credit. The Company is also required to pay certain fees to the administrative agent under the Credit Facility. As of September 27, 2025, the interest rate applicable to Base Rate borrowings was 7.3 %, and the interest rate applicable to one-month SOFR-based borrowings was 5.2 %.
The Company incurred approximately $2.4 million of debt issuance costs in conjunction with this transaction, which included lender fees and legal expenses. The debt issuance costs are being amortized over the term of the Credit Facility.
F-25
CENTRAL GARDEN & PET COMPANY
NOTES TO CONSOLIDATED FINANCIAL STATEMENTS (Continued)
The Credit Facility contains customary covenants, including financial covenants which require the Company to maintain a minimum fixed charge coverage ratio of 1 :1 upon triggered quarterly testing (e.g. when availability falls below certain thresholds established in the agreement), reporting requirements and events of default. The Credit Facility is secured by substantially all assets of the borrowing parties, including (i) pledges of 100 % of the stock or other equity interest of each domestic subsidiary that is directly owned by such entity and (ii) 65 % of the stock or other equity interest of each foreign subsidiary that is directly owned by such entity, in each case subject to customary exceptions. The Company was in compliance with all financial covenants under the Credit Facility as of September 27, 2025.
The scheduled principal repayments on long-term debt as of September 27, 2025 are as follows:
| (in thousands) | ||||||||
| Fiscal year: | ||||||||
| 2026 | $ | |||||||
| 2027 | ||||||||
| 2028 | ||||||||
| 2029 | ||||||||
| 2030 | ||||||||
| Thereafter | ||||||||
| Total | $ | (1) | ||||||
(1)Debt repayments do not reflect the unamortized portion of deferred financing costs associated with the 2028 Notes, 2030 Notes and 2031 Notes of approximately $8.5 million as of September 27, 2025, of which, $1.1 million is amortizable until February 2028, $4.0 million is amortizable until October 2030 and $3.4 million is amortizable until April 2031, and are included in the carrying value.
12.Commitments and Contingencies
Commitments
Letters of credit – The Company had $3.0 million of outstanding letters of credit related to normal business transactions at September 27, 2025. These agreements require the Company to maintain specified amounts of cash as collateral in segregated accounts to support the letters of credit issued thereunder, which will affect the amount of cash the Company has available for other uses. The amount of cash collateral in these segregated accounts was $15.9 million and $14.9 million as of September 27, 2025 and September 28, 2024, respectively, and is reflected in “Restricted cash” on the Company's consolidated balance sheets.
Purchase commitments – Production and purchase agreements (primarily for grass seed and grains) entered into in the ordinary course of business may obligate the Company to make future purchases based on estimated yields. The terms of these contracts vary; some have fixed prices or quantities while others have variable pricing and quantities. For certain agreements, management estimates are used to develop the quantities and pricing for anticipated purchases, and future purchases could vary significantly from such estimates.
Contingencies
The Company may from time to time become involved in legal proceedings in the ordinary course of business. Currently, the Company is not a party to any legal proceedings the resolution of which management believes could have a material effect on the Company’s financial position or results of operations with the exception of the proceeding below.
In 2012, Nite Glow Industries, Inc and its owner, Marni Markell, (“Nite Glow”) filed suit in the U.S. District Court for New Jersey against the Company alleging that the applicator developed and used by the Company for certain of its branded topical flea and tick products infringes a patent held by Nite Glow and asserted related claims for breach of contract and misappropriation of confidential information based on the terms of a Non-Disclosure Agreement. On June 27, 2018, a jury returned a verdict in favor of Nite Glow on each of the three claims and awarded damages of approximately $12.6 million. The court ruled on post-trial motions in early June 2020, reducing the judgment amount to $12.4 million and denying the plaintiff's request for attorneys' fees. The Company filed its notice of appeal, and the plaintiff cross-appealed. On July 14, 2021, the Federal Circuit Court of Appeals issued its decision on the appeal. The Federal Circuit concluded that the Company did not infringe plaintiff's patent and determined that the breach of contract claim raised no non-duplicative damages and should be dismissed. The court affirmed the jury's liability verdict on the misappropriation of confidential information claim but ordered a new trial on damages on that single claim limited to the "head start" benefit, if any, generated by the confidential information. The retrial on the "head start" damages issue concluded in early March 2024. On September 30, 2025, the court issued its decision awarding the plaintiff $5.0 million, and judgment was entered on October 17, 2025 in the amount of $7.2 million, including prejudgment interest. The Company intends to appeal the judgment and believes that it will prevail in the appeal and in any further proceedings as to the head start damages issue. While the Company believes that the ultimate resolution of this matter will not have a material impact on the Company's consolidated financial
F-26
CENTRAL GARDEN & PET COMPANY
NOTES TO CONSOLIDATED FINANCIAL STATEMENTS (Continued)
statements, the outcome of litigation is inherently uncertain and the final resolution of this matter may result in expense to the Company in excess of management's expectations.
The Company has experienced, and may in the future experience, issues with products that may lead to product liability, recalls, withdrawals, replacements of products, or regulatory actions by governmental authorities. The Company has not experienced recent issues with products, the resolution of which management believes would have a material effect on the Company’s financial position or results of operations.
F-27
CENTRAL GARDEN & PET COMPANY
NOTES TO CONSOLIDATED FINANCIAL STATEMENTS (Continued)
13.Income Taxes
The provision for income tax expense (benefit) consists of the following:
| Fiscal Year Ended | |||||||||||||||||
| September 27, 2025 | September 28, 2024 | September 30, 2023 | |||||||||||||||
| (in thousands) | |||||||||||||||||
| Current: | |||||||||||||||||
| Federal | $ | $ | $ | ||||||||||||||
| State | |||||||||||||||||
| Foreign | ( | ||||||||||||||||
| Total | |||||||||||||||||
| Deferred: | |||||||||||||||||
| Federal | ( | ( | ( | ||||||||||||||
| State | ( | ||||||||||||||||
| Foreign | ( | ||||||||||||||||
| Total | ( | ( | ( | ||||||||||||||
| Total | $ | $ | $ | ||||||||||||||
F-28
CENTRAL GARDEN & PET COMPANY
NOTES TO CONSOLIDATED FINANCIAL STATEMENTS (Continued)
A reconciliation of the statutory federal income tax rate to the Company’s effective income tax rate is as follows:
| Fiscal Year Ended | |||||||||||||||||
| September 27, 2025 | September 28, 2024 | September 30, 2023 | |||||||||||||||
| Statutory federal income tax rate | % | % | % | ||||||||||||||
| State income taxes, net of federal benefit | |||||||||||||||||
| Other permanent differences | ( | ( | ( | ||||||||||||||
| Non-Deductible Officers Compensation | |||||||||||||||||
| Adjustment of prior year accruals | ( | ( | |||||||||||||||
| Credits | ( | ( | ( | ||||||||||||||
| Stock based compensation | ( | ( | ( | ||||||||||||||
| Other | |||||||||||||||||
| Effective income tax rate | % | % | % | ||||||||||||||
The tax effect of temporary differences and carryforwards which give rise to deferred tax assets and liabilities are as follows:
| September 27, 2025 | September 28, 2024 | ||||||||||||||||||||||
| Deferred Tax Assets | Deferred Tax Liabilities | Deferred Tax Assets | Deferred Tax Liabilities | ||||||||||||||||||||
| (in thousands) | |||||||||||||||||||||||
| Allowance for doubtful accounts | $ | $ | — | $ | $ | — | |||||||||||||||||
| Inventory write-downs | — | — | |||||||||||||||||||||
| Prepaid expenses | |||||||||||||||||||||||
| Nondeductible reserves | — | — | |||||||||||||||||||||
| State taxes | — | ||||||||||||||||||||||
| Employee benefits | — | — | |||||||||||||||||||||
| Depreciation and amortization | |||||||||||||||||||||||
| Equity earnings | |||||||||||||||||||||||
| State net operating loss carryforward | — | — | |||||||||||||||||||||
| Stock based compensation | — | — | |||||||||||||||||||||
| State credits | — | — | |||||||||||||||||||||
| Other | — | — | |||||||||||||||||||||
| Valuation allowance | ( | — | ( | — | |||||||||||||||||||
| Total | $ | $ | $ | $ | |||||||||||||||||||
The Company has state net operating loss carryforwards of $82.2 million, which expire at various times between 2025 and 2043, and foreign net operating loss carryforwards of $26 million, which do not expire.
The Company also has state income tax credits of $3 million, which expire at various times beginning in 2026 through 2044. In evaluating the Company’s ability to recover its deferred tax assets, the Company considers all available positive and negative evidence including past operating results, future taxable income, and ongoing prudent and feasible tax planning strategies in assessing the need for a valuation allowance against any deferred tax assets for the parent company and foreign subsidiaries. The Company has determined that insufficient future separate-company state and foreign taxable income is expected to be available to realize the deferred tax assets. Therefore, valuation allowances of $13.3 million and $9.9 million (net of federal impact) at September 27, 2025 and September 28, 2024, respectively, have been provided to reduce state deferred tax assets to amounts considered recoverable.
The Company classifies uncertain tax positions as non-current income tax liabilities unless expected to be paid within one year. The interest and/or penalties related to income tax matters are recognized as a component of pretax income. As of September 27, 2025 and September 28, 2024, accrued interest was less than $0.1 no
F-29
CENTRAL GARDEN & PET COMPANY
NOTES TO CONSOLIDATED FINANCIAL STATEMENTS (Continued)
The following table summarizes the activity related to the Company’s unrecognized tax benefits for fiscal years ended September 27, 2025 and September 28, 2024:
| (in thousands) | |||||
| Balance as of September 30, 2023 | $ | ||||
| Increases related to prior year tax positions | |||||
| Increases related to current year tax positions | |||||
| Decreases related to prior year tax positions | ( | ||||
| Settlements | ( | ||||
| Decreases related to lapse of statute of limitations | ( | ||||
| Balance as of September 28, 2024 | $ | ||||
| Increases related to prior year tax positions | |||||
| Increases related to current year tax positions | |||||
| Decreases related to prior year tax positions | |||||
| Settlements | ( | ||||
| Decreases related to lapse of statute of limitations | ( | ||||
| Balance as of September 27, 2025 | $ | ||||
As of September 27, 2025, unrecognized income tax benefits totaled approximately $0.6 million and all of the unrecognized tax benefits would, if recognized, impact the Company’s effective income tax rate.
The Company is principally subject to taxation by the United States and various states within the United States. The Company’s tax filings in major jurisdictions are open to examination by tax authorities by the Internal Revenue Service from fiscal year ended 2022 forward and in various state taxing authorities generally from fiscal year ended 2021 forward.
The Company believes there is a reasonable chance that its unrecognized tax benefits will decrease by less than $0.1 million within the next twelve months.
14.Stock-Based Compensation
The Company’s 2003 Omnibus Equity Incentive Plan (the “2003 Plan”), as amended, allows for the grant of options, restricted stock and certain other specified types of awards to key employees, directors and consultants of the Company. The 2003 Plan is administered by the Compensation Committee of the Board of Directors, which is comprised only of independent directors, and which must approve individual awards to be granted, vesting and exercise of share conditions.
There are a total of 5.8 million shares of Common Stock, 19.7 million shares of Class A Common Stock and 500,000 shares of Preferred Stock authorized under the 2003 Plan. If and when the Company issues any shares of Preferred Stock under the 2003 Plan, it will reduce the amount of Class A Common Stock available for future issuance in an amount equal to the number of shares of Class A Common Stock that are issuable upon conversion of such Preferred Stock.
The Company has a Nonemployee Director Equity Incentive Plan (the “Director Plan”) which provides for the grant of options and restricted stock to nonemployee directors of the Company. The Director Plan, as amended, provides for the granting to each independent director a number of shares of restricted stock equal to $120,000 divided by such fair market value.
As of September 27, 2025, there were approximately 2.0 no shares of Common Stock and Preferred Stock reserved for outstanding equity awards, and there were approximately 4.6 million shares of Common Stock, 11.0 million shares of Class A Common Stock and 0.5 million shares of Preferred Stock remaining for future awards. In fiscal 2025, no shares were granted from the Director Plan and each independent director was granted restricted shares from the 2003 Plan.
The Company recognized stock-based compensation expense of $21.1 million, $20.6 million, and $28 million for the fiscal years ended September 27, 2025, September 28, 2024 and September 30, 2023, respectively, as a component of selling, general and administrative expenses. Share-based compensation expense in fiscal 2025, 2024 and 2023 consisted of $0.2 million, $0.7 million, and $3.8 million, respectively, for stock options, and $13.2 million, $13.1 million and $16.3 million, respectively, for stock awards. Share-based compensation expense in fiscal 2025, 2024 and 2023 also includes $7.7 million, $6.8 million and $7.9 million, respectively, for the Company’s 401(k) matching contributions.
F-30
CENTRAL GARDEN & PET COMPANY
NOTES TO CONSOLIDATED FINANCIAL STATEMENTS (Continued)
Stock Option Awards
During fiscal 2025 and 2024, the Company did not grant any stock options.
During fiscal 2023, the Company granted time-based stock options with an exercise price 15 % above the market price on the date of the grant. But generally, the Company has granted options at the market price on the date of the grant.
The fair value of each option award is estimated on the date of grant using the Black-Scholes option valuation model. Expected stock price volatilities are estimated based on the historical volatility of the Company’s stock price. The expected term of options granted is based on exercise behavior, option exercises and the contractual term of the option. The risk-free rates are based on U.S. Treasury yields, for notes with comparable terms as the option grants, in effect at the time of the grant. For purposes of this valuation model, no dividends have been assumed.
In fiscal year 2023, the Company’s calculations were made using the Black-Scholes option pricing model with the following weighted average assumptions in fiscal 2023: expected life from the date of grant, 8 years; stock price volatility, 30.6 %; risk free interest rates, 3.6 %; and no dividends during the expected term.
The following table summarizes option activity for the period ended September 27, 2025:
| Number of Shares (in thousands) | Weighted Average Exercise Price per Share | Weighted Average Remaining Contractual Life | Aggregate Intrinsic Value (in thousands) | ||||||||||||||||||||
| Outstanding at September 28, 2024 | $ | $ | |||||||||||||||||||||
| Granted | $ | ||||||||||||||||||||||
| Exercised | ( | $ | |||||||||||||||||||||
| Canceled or expired | ( | $ | |||||||||||||||||||||
| Outstanding at September 27, 2025 | $ | $ | |||||||||||||||||||||
| Exercisable at September 30, 2023 | $ | $ | |||||||||||||||||||||
| Exercisable at September 28, 2024 | $ | $ | |||||||||||||||||||||
| Exercisable at September 27, 2025 | $ | $ | |||||||||||||||||||||
| Expected to vest after September 27, 2025 | $ | $ | |||||||||||||||||||||
The prices of options to purchase shares of Class A common stock outstanding at September 27, 2025, September 28, 2024 and September 30, 2023 were $20.63 to $41.10 per share, $20.63 to $41.10 per share and $20.63 to $41.10 per share, respectively. There were no 12.29 . The total intrinsic value of options exercised during the fiscal years ended September 27, 2025, September 28, 2024 and September 30, 2023 was $2.3 million, $12 million, and $3.9 million, respectively.
Restricted Stock Awards
As of September 27, 2025 and September 28, 2024, there were approximately 1.1 million and 1.4 million shares, respectively, of restricted stock awards outstanding. Awards granted in fiscal 2025 and 2024 generally vest within to five years from the date of grant.
Restricted stock award activity during the period ended September 27, 2025 is summarized as follows:
| Number of Shares | Weighted Average Grant Date Fair Value per Share | ||||||||||
| (in thousands) | |||||||||||
| Nonvested at September 28, 2024 | $ | ||||||||||
| Granted | $ | ||||||||||
| Vested | ( | $ | |||||||||
| Forfeited | ( | $ | |||||||||
| Nonvested at September 27, 2025 | $ | ||||||||||
As of September 27, 2025, there was $19.9 million of unrecognized compensation cost related to nonvested restricted stock awards, which is expected to be recognized over a weighted average period of three years .
F-31
CENTRAL GARDEN & PET COMPANY
NOTES TO CONSOLIDATED FINANCIAL STATEMENTS (Continued)
In fiscal years 2025, 2024 and 2023, the Company granted a combination of performance stock units (PSU’s) and restricted stock awards under its long-term incentive program, which replaced the option or restricted stock awards historically granted annually under the Company’s long-term incentive plan. The impact of granting PSU’s was not material to the Company’s Consolidated Financial Statements.
PSU’s provide the right to receive shares of the Company’s common stock based on the Company’s achievement of certain performance criteria at the end of a four-year measurement period (fiscal 2025-fiscal 2028) and continued employment through the vesting period. The number of shares issued at the end of the performance period may range from 50 % to 225 % of the original target award amount (100 %).
15.Shareholders’ Equity
At September 27, 2025 and September 28, 2024, there were 80,000,000 0.01 9,650,221 and 11,074,620 , respectively, were outstanding, and 100,000,000 0.01 51,618,682 and 54,446,194 , respectively, were outstanding. The preferences and relative rights of the Class A common stock are identical to common stock in all respects, except that the Class A common stock generally has no voting rights unless otherwise required by Delaware law.
There are 3,000,000 0.01 1,602,374 one vote per share and the holders of Class B stock are entitled to the lesser of ten votes per share or 49 % of the total votes cast, (ii) stock dividends on common stock may be paid only in shares of common stock and stock dividends on Class B stock may be paid only in shares of Class B stock and (iii) shares of Class B stock have certain conversion rights and are subject to certain restrictions on ownership and transfer. Each share of Class B stock is convertible into one share of common stock, at the option of the holder. Additional shares of Class B stock may only be issued with majority approval of the holders of the common stock and Class B stock, voting as separate classes.
There are 1,000,000 0.01 none
In August 2019, the Company’s Board of Directors authorized a $100 million share repurchase program, in part, to minimize the dilutive impact of the Company’s stock-based equity compensation programs over time, which authorization was fully utilized in the third quarter of fiscal 2025. During fiscal 2025, we repurchased approximately 3.2 million shares of our non-voting common stock (CENTA) and approximately 1.4 million shares of our voting common stock (CENT) on the open market at an aggregate cost of $148.4 million.
In December 2024, the Company's Board of Directors authorized a $100 million increase in the share repurchase program (the "2024 Repurchase Authorization"). The 2024 Repurchase Authorization has no fixed expiration date and expires when the amount authorized has been used or the Board withdraws its authorization. As of September 27, 2025, the Company had $46.5 million remaining under its 2024 Repurchase Authorization.
F-32
CENTRAL GARDEN & PET COMPANY
NOTES TO CONSOLIDATED FINANCIAL STATEMENTS (Continued)
16.Earnings Per Share
| Fiscal Year Ended September 27, 2025 | Fiscal Year Ended September 28, 2024 | Fiscal Year Ended September 30, 2023 | |||||||||||||||||||||||||||||||||||||||||||||||||||
| Net Income | Shares | Per Share | Net Income | Shares | Per Share | Net Income | Shares | Per Share | |||||||||||||||||||||||||||||||||||||||||||||
| (in thousands, except per share amounts) | |||||||||||||||||||||||||||||||||||||||||||||||||||||
| Basic EPS: | |||||||||||||||||||||||||||||||||||||||||||||||||||||
| Net income available to common shareholders | $ | $ | $ | $ | $ | $ | |||||||||||||||||||||||||||||||||||||||||||||||
| Effect of dilutive securities: | |||||||||||||||||||||||||||||||||||||||||||||||||||||
| Options to purchase common stock | ( | ||||||||||||||||||||||||||||||||||||||||||||||||||||
| Restricted shares | ( | ( | ( | ||||||||||||||||||||||||||||||||||||||||||||||||||
| Performance stock units | ( | ||||||||||||||||||||||||||||||||||||||||||||||||||||
| Diluted EPS: | |||||||||||||||||||||||||||||||||||||||||||||||||||||
| Net income available to common shareholders | $ | $ | $ | $ | $ | $ | |||||||||||||||||||||||||||||||||||||||||||||||
For fiscal 2025, options to purchase 0.3 million shares were not included in the computation of diluted earnings per share because the option exercise prices were greater than the average market price of the common shares and, therefore, the effect of including these options would be anti-dilutive.
For fiscal 2024, options to purchase 0.3 million shares were not included in the computation of diluted earnings per share because the option exercise prices were greater than the average market price of the common shares and, therefore, the effect of including these options would be anti-dilutive.
For fiscal 2023, options to purchase 0.6 million shares were not included in the computation of diluted earnings per share because the option exercise prices were greater than the average market price of the common shares and, therefore, the effect of including these options would be anti-dilutive.
17.Transactions with Related Parties
During fiscal 2025, 2024 and 2023, Tech Pac, a subsidiary of the Company, made purchases from Contract Packaging, Inc, (“CPI”), Tech Pac’s principal supplier and a minority 20 37.0 million, $37.0 million and $31.0 million for fiscal years 2025, 2024 and 2023, respectively. Amounts due to CPI as of September 27, 2025 and September 28, 2024 were $1.7 million and $1.4 million, respectively.
18.Business Segment Data
The Company’s chief operating decision-maker is its Chief Executive Officer. Operating segments are managed separately because each segment represents a strategic business that offers different products or services. The Company’s chief operating decision maker uses operating income or loss to evaluate segment performance and allocate resources, including consideration of plan-to-actual variances and prior year-to-actual variances on a quarterly basis. The Company’s Corporate expenses are included in the following presentation since certain expenses are not allocated separately to the two operating segments. Segment assets exclude short-term investments, goodwill, and deferred taxes.
Management has determined that the Company has two operating segments which are also reportable segments based on the level at which the chief operating decision maker reviews the results of operations to make decisions regarding performance assessment and resource allocation. These operating segments are the Pet segment and the Garden segment. Substantially all of the Company’s assets and operations relate to its business in the United States.
F-33
CENTRAL GARDEN & PET COMPANY
NOTES TO CONSOLIDATED FINANCIAL STATEMENTS (Continued)
The Pet segment consists of Nylabone Products, IMS Trading, Four Paws Products, TDBBS, Central Specialty Pet (Avian and Small Animal, C&S Products and Aquatics), Segrest, K&H Pet Products, Arden, DMC, Life Sciences, Interpet, General Pet and Pet Distribution. These businesses are engaged in the manufacture, purchase, sale and delivery of internally and externally produced pet supplies, animal health and insect controls, aquariums, books, dog treats and food, as well as live fish and small animals principally to independent pet distributors, big-box retailers, regional retailer chains, eCommerce retailers, grocery stores and mass merchants. The Garden segment consists of Grass Seed, Bird Feed, Chemicals and Fertilizers, Excel Marketing, Gulfstream, Cedarworks, Bell Nursery, Hopewell Nursery, DMO, Green Garden, D&D Commodities and Garden Distribution. Products manufactured, designed and sourced, or distributed include products found typically in the lawn and garden sections of mass merchandisers, warehouse-type clubs, home improvement centers and nurseries and include live plants; grass, vegetable, flower and herb seed; wild bird feed, bird houses and other birding accessories; terra-cotta pottery; herbicides, pesticides and insecticides. These products are sold directly to national and regional retail chains, independent garden distributors, online retailers, grocery stores, nurseries and garden supply retailers. Reportable segments have been identified based on financial data utilized to manage our businesses by management. This is derived primarily from differences in products and services and secondarily by differences in the customer base between the two segments.
The Corporate expenses include costs associated with corporate functions such as: Information Technology, Legal, Mergers & Acquisitions and certain employee benefits.
The following table indicates each class of similar products which represented approximately 10% or more of the Company’s consolidated net sales in the fiscal years presented (in millions).
| Category | 2025 | 2024 | 2023 | |||||||||||||||||
| (in millions) | ||||||||||||||||||||
| Other garden products | $ | $ | $ | |||||||||||||||||
| Other pet products | ||||||||||||||||||||
| Other manufacturers' products | ||||||||||||||||||||
| Dog & cat products | ||||||||||||||||||||
| Wild bird | ||||||||||||||||||||
| Total | $ | $ | $ | |||||||||||||||||
See Note 4 – Concentration of Credit Risk and Significant Customers and Suppliers for the Company’s largest customers by segment.
Financial information relating to the Company’s business segments for each of the three most recent fiscal years is presented in the following tables:
Fiscal Year Ended September 27, 2025 | |||||||||||||||||
| Pet | Garden | Total | |||||||||||||||
| (in thousands) | |||||||||||||||||
| Net sales | $ | $ | $ | ||||||||||||||
| Cost of goods sold | |||||||||||||||||
| Selling, general and administrative expenses | |||||||||||||||||
| Segment operating income | $ | $ | $ | ||||||||||||||
| Unallocated corporate expenses | ( | ||||||||||||||||
| Interest expense | ( | ||||||||||||||||
| Interest income | |||||||||||||||||
| Other expense | ( | ||||||||||||||||
| Income before income taxes and noncontrolling interest | $ | ||||||||||||||||
F-34
CENTRAL GARDEN & PET COMPANY
NOTES TO CONSOLIDATED FINANCIAL STATEMENTS (Continued)
Fiscal Year Ended September 28, 2024 | |||||||||||||||||
| Pet | Garden | Total | |||||||||||||||
| (in thousands) | |||||||||||||||||
| Net sales | $ | $ | $ | ||||||||||||||
| Cost of goods sold | |||||||||||||||||
| Selling, general and administrative expenses | |||||||||||||||||
| Segment operating income | $ | $ | $ | ||||||||||||||
| Unallocated corporate expenses | ( | ||||||||||||||||
| Interest expense | ( | ||||||||||||||||
| Interest income | |||||||||||||||||
| Other expense | ( | ||||||||||||||||
| Income before income taxes and noncontrolling interest | $ | ||||||||||||||||
Fiscal Year Ended September 30, 2023 | |||||||||||||||||
| Pet | Garden | Total | |||||||||||||||
| (in thousands) | |||||||||||||||||
| Net sales | $ | $ | $ | ||||||||||||||
| Cost of goods sold | |||||||||||||||||
| Selling, general and administrative expenses | |||||||||||||||||
| Segment operating income | $ | $ | $ | ||||||||||||||
| Unallocated corporate expenses | ( | ||||||||||||||||
| Interest expense | ( | ||||||||||||||||
| Interest income | |||||||||||||||||
| Other income | |||||||||||||||||
| Income before income taxes and noncontrolling interest | $ | ||||||||||||||||
F-35
CENTRAL GARDEN & PET COMPANY
NOTES TO CONSOLIDATED FINANCIAL STATEMENTS (Continued)
| Fiscal Year Ended | |||||||||||||||||
| September 27, 2025 | September 28, 2024 | September 30, 2023 | |||||||||||||||
| (in thousands) | |||||||||||||||||
| Assets: | |||||||||||||||||
| Pet segment | $ | $ | $ | ||||||||||||||
| Garden segment | |||||||||||||||||
| Total reportable segments | |||||||||||||||||
| Corporate and unallocated | |||||||||||||||||
| Total | $ | $ | $ | ||||||||||||||
| Depreciation and amortization: | |||||||||||||||||
| Pet segment | $ | $ | $ | ||||||||||||||
| Garden segment | |||||||||||||||||
| Total reportable segments | |||||||||||||||||
| Corporate and unallocated | |||||||||||||||||
| Total | $ | $ | $ | ||||||||||||||
| Expenditures for long-lived assets: | |||||||||||||||||
| Pet segment | $ | $ | $ | ||||||||||||||
| Garden segment | |||||||||||||||||
| Total reportable segments | |||||||||||||||||
| Corporate and unallocated | |||||||||||||||||
| Total | $ | $ | $ | ||||||||||||||
F-36
CENTRAL GARDEN & PET COMPANY
NOTES TO CONSOLIDATED FINANCIAL STATEMENTS (Continued)
19. Subsequent Events
Asset-Based Loan Facility Amendment
On November 7, 2025, the Company entered into a Fourth Amended and Restated Credit Agreement. The Amended Credit Agreement amends and restates the previous credit agreement dated December 16, 2021 and provides for a $600 million principal amount senior secured asset based revolving credit facility, with up to an additional $400 million principal amount available if the Company exercises the uncommitted accordion feature set forth therein subject to additional commitments by Lenders (collectively, the "New Credit Facility"). The Credit Facility matures on November 7, 2030. The Company may borrow, repay and reborrow amounts under the Credit Facility until its maturity date, at which time all amounts outstanding under the Credit Facility must be repaid in full.
The Credit Facility is subject to a borrowing base calculated using a formula based upon eligible receivables and inventory, and at the Company’s election, eligible real property, minus certain reserves. The Company did not draw down any commitments under the Credit Facility upon closing. Proceeds of the Credit Facility will be used for general corporate purposes. The Credit Facility includes a $50 million sublimit for the issuance of letters of credit and a $75 million sublimit for short-notice borrowings.
Borrowings under the Credit Facility will bear interest at an index based on SOFR (which will not be less than 0.00 %) or, at the option of the Company, the Base Rate (defined as the highest of (a) the Truist prime rate, (b) the Federal Funds Rate plus 0.50 %, (c) one-month SOFR plus 1.00 %, and (d) 0.00 %), plus, in either case, an applicable margin based on the Company’s average availability level under the Credit Facility. The applicable margin for SOFR-based borrowings fluctuates between 1.00 %-1.50 % and was 1.00 % at the time of closing, and the applicable margin for Base Rate borrowings fluctuates between 0.00 %-0.50 %, and was 0.00 % at the time of closing. An unused line fee shall be payable quarterly in respect of the total amount of the unutilized Lenders’ commitments under the Credit Facility, and a letter of credit fee shall be payable quarterly in respect of the average undrawn and unreimbursed amount of letters of credit plus a facing fee to the issuing bank. The Company is also required to pay certain fees to the administrative agent under the Credit Facility.
The Credit Facility contains customary covenants, including a financial covenant which requires the Company to maintain a minimum fixed charge coverage ratio of 1.00 :1.00 at the end of each fiscal quarter in which the covenant has been triggered, reporting requirements and events of default. The Credit Facility is secured by substantially all assets of the Company and its subsidiaries guaranteeing the Credit Facility, including (i) pledges of 100 % of the stock or other equity interest of each domestic subsidiary that is directly owned by such entity and (ii) 65 % of the stock or other equity interest of each foreign subsidiary that is directly owned by such entity, in each case subject to customary exceptions.
F-37