10-K: Annual report pursuant to Section 13 and 15(d)
Published on November 22, 2022
UNITED STATES SECURITIES AND EXCHANGE COMMISSION
Washington, D.C. 20549
________________________________________________________________________________________
FORM 10-K
| ANNUAL REPORT PURSUANT TO SECTION 13 or 15(d) OF THE SECURITIES EXCHANGE ACT OF 1934 | |||||
For the fiscal year ended September 24 , 2022
OR
| TRANSITION REPORT PURSUANT TO SECTION 13 or 15(d) OF THE SECURITIES EXCHANGE ACT OF 1934 | |||||
For the transition period from ________ to ________
Commission File Number 1-33268
Central Garden & Pet Company
(Exact name of registrant as specified in its charter)
| (State or other jurisdiction of incorporation or organization) | (IRS Employer Identification Number) | ||||
(Address of principal executive offices) (Zip Code)
Telephone Number: (925 ) 948-4000
SECURITIES REGISTERED PURSUANT TO SECTION 12(b) OF THE ACT:
| Title of Each Class | Trading Symbol(s) | Name of Each Exchange on Which Registered | ||||||
SECURITIES REGISTERED PURSUANT TO SECTION 12(g) OF THE ACT: None
Indicate by check mark if the registrant is a well-known seasoned issuer, as defined in Rule 405 of the Securities Act. Yes ☒ No ☐
Indicate by check mark if the registrant is not required to file reports pursuant to Section 13 or Section 15(d) of the Act. Yes ☐ No ☒
Indicate by check mark whether the registrant (1) has filed all reports required to be filed by Section 13 or 15(d) of the Securities Exchange Act of 1934 during the preceding 12 months (or for such shorter period that the registrant was required to file such reports), and (2) has been subject to such filing requirements for the past 90 days. Yes ☒ No ☐
Indicate by check mark whether the registrant has submitted electronically every Interactive Data File required to be submitted pursuant to Rule 405 of Regulation S-T (§ 232.405 of this chapter) during the preceding 12 months (or for such shorter period that the registrant was required to submit and post such files). Yes ☒ No ☐
Indicate by check mark whether the registrant is a large accelerated filer, an accelerated filer, a non-accelerated filer, smaller reporting company, or an emerging growth company. See the definitions of “large accelerated filer,” “accelerated filer,” “smaller reporting company,” and "emerging growth company" in Rule 12b-2 of the Exchange Act.
Smaller reporting company ☐ Emerging growth company ☐
If an emerging growth company, indicate by check mark if the registrant has elected not to use the extended transition period for complying with any new or revised financial accounting standards provided pursuant to Section 13(a) of the Exchange Act. ☐
Indicate by check mark whether the registrant has filed a report on and attestation to its management's assessment of the effectiveness of its internal control over financial reporting under Section 404(b) of the Sarbanes-Oxley Act (15 U.S.C. 7262(b)) by the registered public accounting firm that prepared or issued its audit report. ☒
Indicate by check mark whether the registrant is a shell company (as defined in Rule 12b-2 of the Exchange Act). Yes ☐ No ☒
At March 26, 2022, the aggregate market value of the registrant’s Common Stock, Class A Common Stock and Class B Stock held by non-affiliates of the registrant was approximately $438.2 million, $1.7 billion and $86 thousand, respectively.
At November 11, 2022, the number of shares outstanding of the registrant’s Common Stock was 11,266,889 and the number of shares outstanding of Class A Common Stock was 41,252,435 . In addition, on such date, the registrant had outstanding 1,602,374 shares of its Class B Stock, which are convertible into Common Stock on a share-for-share basis.
DOCUMENTS INCORPORATED BY REFERENCE
Central Garden & Pet Company
Index to Annual Report on Form 10-K
For the fiscal year ended September 24, 2022
| Page | ||||||||
| PART I | ||||||||
| Item 1. | ||||||||
| Item 1A. | ||||||||
| Item 1B. | ||||||||
| Item 2. | ||||||||
| Item 3. | ||||||||
| Item 4. | ||||||||
| PART II | ||||||||
| Item 5. | ||||||||
| Item 6. | ||||||||
| Item 7. | ||||||||
| Item 7A. | ||||||||
| Item 8. | ||||||||
| Item 9. | ||||||||
| Item 9A. | ||||||||
| Item 9B. | ||||||||
| Item 9C. | ||||||||
| PART III | ||||||||
| Item 10. | ||||||||
| Item 11. | ||||||||
| Item 12. | ||||||||
| Item 13. | ||||||||
| Item 14. | ||||||||
| PART IV | ||||||||
| Item 15. | ||||||||
| Item 16. | ||||||||
i
FORWARD-LOOKING STATEMENTS
This Form 10-K includes “forward-looking statements.” Forward-looking statements include statements concerning our plans, objectives, goals, strategies, future events, future revenues or performance, projected cost savings, capital expenditures, financing needs, plans or intentions relating to acquisitions, our competitive strengths and weaknesses, our business strategy and the trends we anticipate in the industries and markets in which we operate and other information that is not historical information. When used in this Form 10-K, the words “estimates,” “expects,” “anticipates,” “projects,” “plans,” “intends,” “believes” and variations of such words or similar expressions are intended to identify forward-looking statements. All forward-looking statements, including, without limitation, our examination of historical operating trends, are based upon our current expectations and various assumptions. Our expectations, beliefs and projections are expressed in good faith, and we believe there is a reasonable basis for them, but we cannot assure you that our expectations, beliefs and projections will be realized.
There are a number of risks and uncertainties that could cause our actual results to differ materially from the forward-looking statements contained in this Form 10-K. Important factors that could cause our actual results to differ materially from the forward-looking statements we make in this Form 10-K are set forth in this Form 10-K, including the factors described in the section entitled “Item 1A – Risk Factors.” If any of these risks or uncertainties materializes, or if any of our underlying assumptions are incorrect, our actual results may differ significantly from the results that we express in or imply by any of our forward-looking statements. We do not undertake any obligation to revise these forward-looking statements to reflect future events or circumstances, except as required by law. Presently known risk factors include, but are not limited to, the following factors:
•high inflation, a potential recession and other adverse macro-economic conditions;
•fluctuations in market prices for seeds and grains and other raw materials;
•our inability to pass through cost increases in a timely manner;
•fluctuations in energy prices, fuel and related petrochemical costs;
•declines in consumer spending and increased inventory risk during economic downturns;
•our ability to successfully manage the continuing impact of COVID-19 on our business, including but not limited to, the impact on our workforce, operations, fill rates, supply chain, demand for our products and services, and our financial results and condition;
•the potential for future reductions in demand for product categories that benefited from the COVID-19 pandemic, including the potential for reduced orders as retailers work through excess inventory;
•adverse weather conditions;
•the success of our Central to Home strategy;
•risks associated with our acquisition strategy, including our ability to successfully integrate acquisitions and the impact of purchase accounting on our financial results;
•supply chain delays and disruptions resulting in lost sales, reduced fill rates and service levels and delays in expanding capacity and automating processes;
•seasonality and fluctuations in our operating results and cash flow;
•supply shortages in pet birds, small animals and fish;
•dependence on a small number of customers for a significant portion of our business;
•consolidation trends in the retail industry;
•risks associated with new product introductions, including the risk that our new products will not produce sufficient sales to recoup our investment;
•competition in our industries;
•continuing implementation of an enterprise resource planning information technology system;
•potential environmental liabilities;
•risk associated with international sourcing;
•impacts of tariffs or a trade war;
•access to and cost of additional capital;
•potential goodwill or intangible asset impairment;
ii
•our dependence upon our key executives;
•our ability to recruit and retain new members of our management team to support our growing businesses and to hire and retain employees;
•our inability to protect our trademarks and other proprietary rights;
•litigation and product liability claims;
•regulatory issues;
•the impact of product recalls;
•potential costs and risks associated with actual or potential cyber attacks;
•potential dilution from issuance of authorized shares;
•the voting power associated with our Class B stock; and
•the impact of new accounting regulations and the possibility our effective tax rate will increase as a result of future changes in the corporate tax rate or other tax law changes.
MARKET, RANKING AND OTHER DATA
The data included in this Form 10-K regarding markets and ranking, including the size of certain markets and our position and the position of our competitors and products within these markets, are based on both independent industry publications, including The Freedonia Group Lawn Care Consumer Insights, October 2022; 2021 National Gardening Survey; Packaged Facts Home and Garden Pesticides, December 2020; The Freedonia Group Outdoor Living Products, May 2021; Packaged Facts Lawn and Garden Consumables, December 2020; Packaged Facts U.S. Pet Market Outlook, 2022-2023, March 2022; Packaged Facts Pet Market Sizing Spreadsheet, August 2022; Packaged Facts Pet Stores and Pet Specialty Retailing, August 2022; Packaged Facts Durable Dog and Cat Pet Care Products, May 2022; American Pet Products Association (APPA) National Pet Owners Survey 2021-22; IBIS World Industry Report 45391 Pet Stores in the U.S., April 2019; U.S. Census Bureau; and our estimates based on management’s knowledge and experience in the markets in which we operate. Our estimates have been based on information provided by customers, suppliers, trade and business organizations and other contacts in the markets in which we operate. While we are not aware of any misstatements regarding our market and ranking data presented herein, our estimates involve risks and uncertainties and are subject to change based on various factors, including those discussed under the heading “Risk factors” in this Form 10-K. This information may prove to be inaccurate because of the method by which we obtained some of the data for our estimates or because this information cannot always be verified with complete certainty due to the limits on the availability and reliability of raw data, the voluntary nature of the data gathering process and other limitations and uncertainties inherent in a survey of market size. As a result, you should be aware that market, ranking and other similar data included herein, and estimates and beliefs based on that data, may not be reliable. We cannot guarantee the accuracy or completeness of such information contained herein.
TRADEMARKS, SERVICE MARKS AND TRADE NAMES
We own or have rights to use trademarks, service marks and trade names in connection with the operation of our business. In addition, our names, logos and website names and addresses are or include our service marks or trademarks. Other trademarks, service marks and trade names appearing in this Form 10-K are the property of their respective owners. Some of the trademarks, service marks and trade names referred to in this Form 10-K may be listed without the ® or ™ symbols, but the absence of such symbols does not indicate whether or not they are registered. We will assert, to the fullest extent under applicable law, our rights or the rights of the applicable licensors to these trademarks, service marks and trade names.
iii
PART I
Item 1. Business
Our Company
Central Garden & Pet Company (“Central”) is a market leader in the garden and pet industries in the United States. For over 40 years, Central has proudly nurtured happy and healthy homes by bringing innovative and trusted solutions to consumers and customers. We manage our operations through two reportable segments: Pet and Garden.
Our Pet segment includes dog and cat supplies such as dog treats and chews, toys, pet beds and grooming products, waste management and training pads, pet containment; supplies for aquatics, small animals, reptiles and pet birds including toys, cages and habitats, bedding, food and supplements; products for equine and livestock, animal and household health and insect control products; live fish and small animals as well as outdoor cushions. These products are sold under brands such as Aqueon®, Cadet®, Comfort Zone®, Farnam®, Four Paws®, K&H Pet Products® ("K&H"), Kaytee®, Nylabone® and Zilla®.
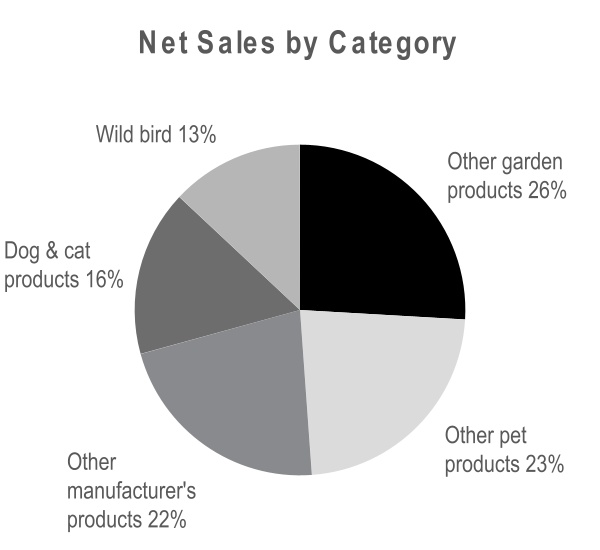
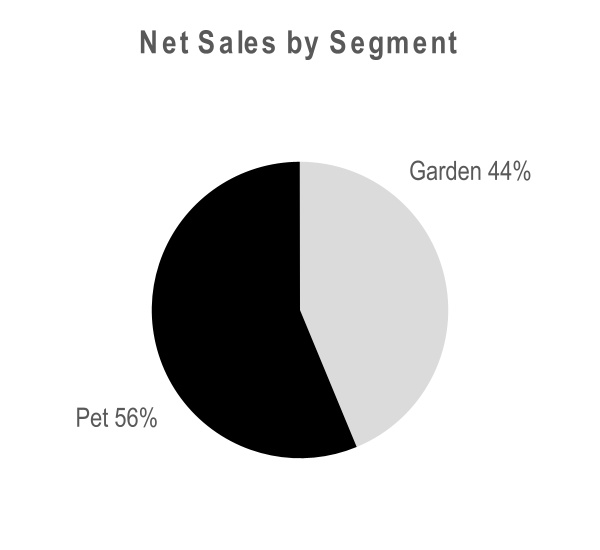
Our Garden segment includes lawn and garden consumables such as grass seed, vegetable, flower and herb packet seed; wild bird feed, bird houses and other birding accessories; weed, grass, and other herbicides, insecticide and pesticide products; fertilizers and live plants. These products are sold under brands such as Amdro®, Ferry-Morse®, Pennington® and Sevin®.
The following charts indicate each class of similar products that represented approximately 10% or more of our consolidated net sales and the percentage of net sales represented by each segment in fiscal 2022.
Strategy
Our Central to Home strategy reinforces our unique purpose to nurture happy and healthy homes and our ambition to lead the future of the pet and garden industries. Our objective is to grow net sales, operating income and cash flows by developing new products, increasing market share, acquiring businesses and working in partnership with our customers to grow the categories in which we participate. We run our business with a long-term perspective, and we believe the successful delivery of our strategy will enable us to create long-term value for all our stakeholders. To achieve our objective, we plan to capitalize on our competitive strengths and favorable industry trends by executing on five key strategic pillars to drive long-term growth:
Consumer: Build and Grow Brands that Consumers Love
To grow, we are seeking to develop more differentiated new products and reinvest some of our annual cost savings in brand building and demand creation to help us drive sustainable organic growth and build market share. We continuously strive to get a deeper understanding of our consumers, including what products and features they desire and how they make their purchasing decisions. We are investing in consumer insights, data analytics and research and development to achieve our innovation goals with a strong pipeline of new products. We recognize that consumers are increasingly researching, as well as buying products online. Therefore, we are advancing our digital capabilities. One key area is in marketing communication where we are working to better reach consumers at key points in their path to purchase with advanced capabilities in precision marketing, search engine optimization and social listening, to name a few. We are seeing promising early marketing campaign results driving accelerated growth and share gains across several brands, including our Pennington "Smart from The Start" and Kaytee "All for the Small" campaigns.
1
Customer: Win with Winning Customers and Channels
We are building on our strong customer relationships by developing and executing winning category growth strategies. We produce both branded and private label products for our customers as well as distribute third-party brands that give our retail partners a breadth of selection from premium to value products. Recent trends have shown that eCommerce channels, including pure-play, omnichannel and direct-to-consumer, are the preferred solutions for today's convenience-oriented consumers. To address the changing consumer landscape, we are building out our digital and eCommerce capabilities while also ensuring we have the right policies, products and programs to allow all channels to compete effectively. Concurrently, we are optimizing our supply chain for high-demand eCommerce items to ensure customer and consumer availability requirements are met at optimal cost. Finally, we are also investing in sales planning, net revenue management and price pack architecture.
Central: Fortify the Central Portfolio
We are managing each business differentially, based on clearly articulated strategies that define the role of each business within our portfolio. We have assessed the profitability and growth potential of each of our businesses. All businesses have clear roles in the portfolio and a strategy that is consistent with that role. Some of our businesses are managed to optimize top-line growth, whereas others are more focused on reducing costs and maximizing operating income.
We are building out our portfolio in attractive, broadly defined pet and garden markets. We are supplementing our organic growth with acquisitions and joint ventures. Our M&A priorities are to build scale in our core pet and garden categories, enter priority adjacencies and enhance key capabilities, for example in digital and eCommerce. We generally seek growth and margin accretive, brand-focused companies with talented management teams. We are also committed to divesting businesses where we cannot find a path to profitability and have done so in the past, for example the disposal of our dog and cat food business in 2020.
Central Ventures, our venture fund which we established in 2020, further supports our M&A strategy. Our objective is to partner with leading entrepreneurs and innovators in the garden and pet industries and leverage our experience and capabilities to accelerate growth. The fund is primarily focused on three emerging growth areas across the pet and garden industries: sustainability, health and wellness, and digitally connected products and services.
Grounded in our purpose to nurture happy and healthy homes, we are working towards a more sustainable future for all. We believe we have not only the opportunity but also the responsibility to make a difference and drive positive change. Our Central Impact Strategy - focused on protecting our planet, cultivating our communities and empowering our employees - is our commitment and approach to sustainability.
Cost: Reduce Cost to Improve Margins and Fuel Growth
Optimizing our supply chain footprint is a priority as we seek to become more efficient and cost-effective. Having the right facilities in the right locations is critical to lowering costs and enabling our businesses to meet the demands of our existing and new customers. We have already consolidated some of our dog and cat treat and toy businesses and numerous garden manufacturing facilities. We recently combined our outdoor cushion business with our pet bedding business given the synergies in sourcing, manufacturing and innovation. In addition, while we value being a business-unit led company, we believe we have significant opportunities to improve our performance by driving processes and programs that allow us to align for scale and share best practices across our business units. For example, we’ve simplified our portfolio by eliminating thousands of SKUs, shifted some of our wild bird and garden controls production from co-manufacturers to our own plants and invested in automation in many of our businesses.
Culture: Strengthen Our Entrepreneurial Business-Unit Led Growth Culture
Our values, created by leaders across the Company, are the cornerstone of our culture, and they are at the root of every decision we make – we call them “The Central Way.” We believe having a strong set of values provides a foundation for employees and strengthens how we all work together. They comprise six simple values: “We do the right thing.” ”We strive to be the best.” “We are entrepreneurial.” “We win together.” “We grow every day.” and “We are passionate."
We believe our employees work at Central because they love the pet and garden categories and that creates a passionate and effective team. We strive to make Central a great place to work that embraces diversity and inclusion. In fiscal 2020, we implemented a diversity and inclusion council and introduced our diversity and inclusion strategy, which reflects our dedication to making meaningful progress in the areas where we can have the most impact including recruiting, employee education, mentorship and leadership development. Over the course of the past year, we formalized our mentorship program, designed for mid- to senior-level leaders, with a focus on women and people of color who have a desire to build their career and leadership skills. The intent is to develop strong and diverse talent in our future leaders, while fostering cross-level relationships.
2
In 2022, our 150 top leaders from across all business units and functions came together for the first Central Leadership Council Summit. Over the course of the Summit, we reaffirmed our conviction and ownership of our Central to Home strategy, shared best practices, celebrated accomplishments, and strengthened our winning culture.
Competitive Strengths
We believe we have a number of competitive strengths, which serve as the foundation of our Central to Home strategy, including the following:
Broad Portfolio of Leading Brands Across Key Garden and Pet Segments
We are one of the leaders in the U.S. pet supplies market and the lawn and garden consumables market. We have a diversified portfolio of brands in both segments, many of which are among the leading brands in their respective market categories, ranging from Kaytee in pet bird and small animal, Nylabone in dog toys, Cadet in dog treats and chews, Four Paws in waste management and grooming, K&H in heated pet products, Aqueon in aquatics and Farnam in equine to Pennington in wild bird products, grass seed and fertilizer, Ferry-Morse in packet seed and Amdro in controls. The majority of our brands have been marketed and sold for more than 40 years.
Robust Financial Performance
We have demonstrated strength in our financial performance, in net sales, earnings and cash flow. Our net sales grew on average 10.2% annually over the last five years, driven by acquisitions and organic growth. Operating income grew slightly faster over the same period, 10.8% on a GAAP basis annually. We have a strong cash and liquidity position driven by a combination of capital raises and cash flow from operations which puts us in a strong position to grow further through both acquisitions and organically.
Proven Track Record of M&A
Since 1992, we have completed over 60 acquisitions to create a company of approximately $3.3 billion in net sales. These acquisitions have successfully expanded the breadth of our pet and garden portfolios. We acquired D&D Commodities Ltd. ("D&D"), a leading provider of premium bird feed in June 2021 and Green Garden Products, a leading provider of vegetable, herb and flower packet seed, seed starters and plant nutrients in February 2021. In December 2021, we acquired Hopewell Nursery, a leading live goods grower and DoMyOwn®, a leading and fast-growing online retailer of professional-grade control products.
We are a patient and disciplined value buyer, typically focused on opportunities that build scale in our core garden and pet categories or in priority adjacencies, with a recent emphasis on those that enhance key capabilities, for example in digital and eCommerce. We are open to businesses that, on top of traditional operating synergies, can leverage our expertise and capabilities and allow us to add value through our low-cost manufacturing and distribution competencies. We generally prefer to acquire brand-focused businesses with growth and margin rates above Central’s rates, with proven, seasoned management teams, who are committed to stay with the acquired business after closing. We have been successful in growing our acquisitions organically after acquiring them into our portfolio. We continually review our businesses to ensure they meet expectations and have implemented strategies to reverse sub-par performance when necessary.
Strong Relationships with Retailers
We have developed strong relationships with major and independent brick & mortar and online retailers, providing them broad product offerings including new product innovation, premium brands, private label programs, proprietary sales and logistics capabilities and a high level of customer service. Major retailers value the efficiency of dealing with suppliers with national scope and strong brands. We believe our ability to meet their unique needs for packaging and point of sale displays provides us with a competitive advantage. Independent retailers value our high level of customer service and broad array of premium branded products. We believe these strengths have assisted us in becoming one of the largest pet supplies vendors to Costco, Walmart and Petco and among the largest lawn and garden consumables vendors to Home Depot, Walmart and Lowe’s, and the club and mass merchandise channels, as well as a leading supplier to independent pet and lawn and garden retailers in the United States.
In fiscal 2022, Bell Nursery was awarded the Home Depot Environmental Partner of the Year recognizing Bell Nursery’s commitment to sustainability and Petco recognized Central as the Companion Animal Vendor of the Year. Pet Supplies Plus acknowledged one of our leaders with the prestigious Lifetime Achievement Award at their annual Suppliers Awards meeting and our pet distribution business was awarded the 2022 Distributor of the Year Award by Petsense by Tractor Supply. In fiscal 2021, Bell Nursery was awarded Home Depot's Supplier Partner of the Year.
Walmart, our largest customer, represented approximately 17% of our total company net sales in fiscal 2022 and 16% in fiscal 2021. Home Depot, our second largest customer, represented approximately 16%, and 15% of our total company net sales in fiscal 2022 and 2021, respectively. Lowe's, Costco and Petco are also significant customers, and together with Walmart and Home Depot, accounted for approximately 51% of our net sales in both fiscal 2022 and 2021.
3
Leading Manufacturing, Sales and Distribution Network
We manufacture the majority of our branded products in our network of manufacturing facilities, located primarily in the United States. In addition, some of our proprietary branded products are manufactured by contract manufacturers, including one of our registered active ingredients, (S)-Methoprene, which is manufactured by a third party under an exclusive arrangement.
We are a leading supplier to independent specialty retailers for the pet supplies market and the lawn and garden consumables market. Our sales and distribution facilities are strategically placed across the United States to allow us to service both our mass market customers as well as independent specialty retail stores, serving traditional brick & mortar but increasingly also omnichannel and pure-play retailers selling only through the internet. In addition, we operate facilities in China, Canada, the United Kingdom and Mexico. This network also supports distribution of many other manufacturers’ brands and combines these products with our branded products into single shipments, enabling us to serve our customers in an effective and cost-efficient manner. We believe this gives us a competitive advantage over other suppliers as this network provides us with key access to independent pet specialty retail stores and retail lawn and garden customers that require two-step distribution, facilitating acquisition and maintenance of shelf placement, prompt product replenishment, customization of retailer programs, quick responses to changing customer and retailer preferences, rapid deployment and feedback for new products and immediate exposure for new internally developed and acquired brands.
We plan to continue to utilize our team of dedicated salespeople and our sales and logistics networks to expand sales of our branded products.
Strong and Experienced Leadership Team
Our leadership team is committed to delivering value for all our stakeholders and is comprised of highly tenured professionals, combining both deep Central and consumer products industry expertise. We believe the depth and breadth of their perspectives and experiences create an optimal foundation for our entrepreneurial business-unit led growth culture and facilitates innovation, which is critical to capturing and maintaining market share.
Pet Segment
Pet Overview
We are one of the leading producers and marketers of pet supplies in the United States. In addition, our Pet segment operates one of the largest sales and distribution networks in the industry, strategically supporting our brands.
Pet Industry Background
The pet industry includes food, supplies, veterinary care and non-medical services, and live animals. We operate primarily in the pet supplies segment of the industry as well as in the live fish and small animal categories. The pet supplies segment includes: products for dogs and cats including edible bones, premium healthy edible and non-edible chews, rawhide, toys, pet beds, pet containment, grooming supplies and other accessories; products for birds, small animals and specialty pets including cages and habitats, toys, food and chews and related accessories; animal and household health and insect control products; products for fish, reptiles and other aquarium-based pets including aquariums, terrariums, stands and lighting fixtures, pumps, filters, water conditioners, food and supplements, and information and knowledge resources; as well as products for equine and livestock. The total annual retail sales of the pet food, treats and chews, supplies, veterinary and non-medical services and live animal industry in 2022 was estimated by Packaged Facts to have been approximately $131 billion. We expect the industry to continue to grow from that foundation. Based on Packaged Facts estimates for 2022, we estimate the annual retail sales of the pet supplies, live animal and treats and chews markets in the categories in which we participate to be approximately $30 billion.
According to Packaged Facts, the U.S. pet supplies market is highly fragmented with over 2,500 manufacturers, ranging from mostly single-category or limited-range players to approximately two dozen companies with a solid multi-category presence. The majority of these smaller companies do not have a captive sales and logistics network and rely on us or other independent distributors to supply their products to regional pet specialty chains and independent retailers.
The pet food and supplies industry retail channel is composed of a wide range of retailers, from national chains like Petco and PetSmart to approximately 14,000 independent pet specialty stores in addition to mass-market, online and other retailers. In the last decade, independent pet stores have suffered not only from growing online competition, but also competition from mass-market retailers expanding their pet offerings with services and private label products. Following a surge in online ordering for at-home delivery or curbside pickup during the pandemic, eCommerce growth has somewhat moderated today but continues to outpace brick-and-mortar. To counter the success of online retailers, brick-and-mortar based retailers are continuing to add veterinary and non-medical services to their offerings, such as grooming, boarding, and training, attempting to drive in-store traffic and increase profitability.
4
Long-Term Pet Industry Characteristics
Long term, we believe the U.S. pet supplies market will continue to grow due to favorable demographic and wellness trends tracking within Pet. During the Covid-pandemic, the pet supplies market benefited from the addition of millions of pets, the heightened focus on wellness among pet owners, the rush of online shopping and adaptability of consumers, marketers, retailers and service providers to meet every pet's healthcare needs. A 2022 Packaged Facts survey found that approximately 95% of U.S. pet owners view their pet as family. The pandemic has elevated concerns over human and pet health and wellness and almost 90% of pet owners agree that they look for products to improve their pet's health and well-being. Pet adoption has been higher among the younger generations as Gen Z adults are joining the pet owner pool, with 45% of pets now being owned by Millennials and Gen Z, which should support continued growth.
Branded Pet Products
Our principal pet supplies categories are dog and cat supplies, dog treats and chews; aquatics and reptile supplies, small animal and pet bird supplies, animal health products as well as live fish and small animals. Our Nylabone brand is one of the leading brands in dog toys and treats, Kaytee in pet birds and small animal, Farnam in equine, Aqueon in aquatics and Comfort Zone in cat calming. In addition, we operate our Arden Companies® outdoor cushion business in the Pet segment due to synergies in sourcing, manufacturing and innovation with our pet bedding business.
We continuously seek to introduce new products, both as complementary extensions of existing product lines and in new product categories. In fiscal 2022, we launched our new GoodGood dog supplements line with no artificial colors and only natural flavors. We also launched Nylabone Gourmet style dog chew toys, which are uniquely crafted with enticing gourmet flavor bits roasted throughout. In fiscal 2021, we launched our new Comfort Zone Opticalm™ diffuser, helping cats feel safe and happy. We also launched a patented aquarium kit with smart clean technology under our Aqueon brand. It combines the easy to clean function fish keepers need with the styling and design they want. We introduced Field+Forest by Kaytee premium small animal food, hay and hay rolls with wholesome ingredients, carefully curated from nature's fields and forests to support a healthy diet.
Over the last two years, many of our pet products have won industry awards. In fiscal 2022, Field + Forest by Kaytee Hay Bale was selected as an Editor’s Choice Winner by Pet Product News, Nylabone again won Chew Toy Product of the Year award, Kaytee NutriSoft™ was selected as winner of the Bird Food Product of the Year award and Vetrolin® Bath was selected as winner of the Shampoo Product of the Year award in the 2022 Pet Independent Innovation Awards. At SuperZoo 2022, Aqueon Stick’ems and Zilla Rapid Sense Décor won first place in the New Product Showcase award in the Aquatics and Herptile category. In fiscal 2021, Nylabone won Chew Toy Product of the Year in the 2020 Pet Independent Innovation Awards. At SuperZoo 2021, Farnam earned Top Honors in Equine for its Apple Elite electrolyte pellets. Kaytee's Superfood Treat Stick won an Editors choice award from Pet Product News International. Eight of our pet brands (Aqueon, Coralife®, Four Paws, K&H, Kaytee, Magic Coat®, Nylabone and Zilla) were recognized by Newsweek in August 2021 as America's Best Petcare Brands.
Dog and Cat. Our dog and cat category, featuring brands such as Cadet, Four Paws, Healthy Edibles®, K&H, Mikki, Nylabone, Nubz®, NutriDent® among others, is an industry leader in manufacturing and marketing premium edible and non-edible chews, interactive toys, grooming supplies and pet beds, pet containment, training and waste management solutions.
Aquatics and Reptile Supplies. We are a leading supplier of aquariums and terrariums as well as related fixtures and stands, water conditioners and supplements, water pumps and filters, sophisticated lighting systems and accessories featuring the brands Aqueon, Blagdon®, Coralife, Interpet® and Zilla.
Small Animal and Bird Supplies. We are a leading manufacturer of supplies and pet food for small animals, pet birds and wild birds. We offer a full range of products including species specific diets, treats, habitats, bedding, hay and toys under brands such as Kaytee, Critter Trail, C&S Products®, and Field+Forest by Kaytee. Many of our branded wild bird mixes are treated with a proprietary blend of vitamins and minerals. Our brands are some of the most widely recognized and trusted brands for birds and small animals.
Animal Health (Health & Wellness, Equine and Professional). We supply calming products under the Comfort Zone brand, dog supplements under our GoodGood brand as well as flea and tick controls under the Adams® brand. We also offer innovative products for horses in the fly control, supplements, grooming, deworming, wound care, leather care and rodenticides categories. Our portfolio of brands for equine includes Farnam, Horse Health™ Products, Vita Flex®, Just One Bite® and Rodentex™. These brands, along with sub-brands including Bronco®, Endure®, IverCare®, Horseshoer’s Secret®, Red Cell®, Sand Clear™, Super Mask® II and Vetrolin® position us as a leader in these categories. Moreover, we are a leading supplier of insect control products sold into various markets. We are the only domestic producer of (S)-Methoprene, which is an active ingredient used to control mosquitoes, flies, fleas, beetles and ants in many professional and consumer insect control applications. Our products are sold primarily under the Starbar® and Zoëcon® family of brands, as well as standalone brands such as Altosid®, Centynal™, ClariFly®IGR, Diacon®, Essentria® and Extinguish®. We also sell (S)-Methoprene to manufacturers of other insect control products, including Frontline Plus.
Live Fish and Small Animals. Segrest and SunPet are leading wholesalers of aquarium fish and plants, reptiles and small animals to pet specialty and mass merchandiser stores as well as public aquariums and research institutions.
5
Outdoor cushions. We sell Arden-branded outdoor cushions through major retailers, both in-store and online, and private label outdoor cushions through the largest big box stores in North America, all leveraging Arden's EverTru-branded outdoor fabric. Our OceanTex™ fabrics, developed by EverTru, are responsibly made and composed of up to 100% recycled materials, including reclaimed ocean plastic and fishing nets.
Pet Sales and Distribution Network
Our domestic sales and distribution network exists to promote both our proprietary brands and third-party partner brands. It provides value-added service to over 9,800 retailers, many of which are independent specialty stores with fewer than 10 locations, and over 6,400 veterinary offices. This includes acquisition and maintenance of premium shelf placement, prompt product replenishment, customization of retailer programs, quick response to changing customer and retailer preferences, rapid deployment and feedback for new products and immediate exposure for acquired brands. The combination of brands in the network that are supplied in single shipments enables our independent customers to work with us on a cost-effective basis to meet their pet supplies requirements. We also operate a sales and logistics facility in the United Kingdom.
Pet Sales and Marketing
Our sales strategy is multi-tiered and designed to capture maximum market share with retailers. Our customers include retailers, such as club, regional and national specialty pet stores, independent pet retailers, mass merchants, grocery and drug stores, as well as the eCommerce channel. We also serve the professional market with insect control and health and wellness products for use by veterinarians, municipalities, farmers and equine product suppliers. Costco Wholesale accounted for approximately 11% of our Pet segment's net sales in both fiscal 2022 and 2021. Walmart, Petco, Amazon and Kroger are also significant customers.
To optimize our product placement and visibility in retail stores, our focused sales resources are segmented as follows:
•a sales organization operating by category and channel;
•dedicated account teams servicing our largest customers;
•a group of account managers focused on regional chains;
•a geographic based group of territory managers dedicated to the independent retailer; and
•a specialized group of account managers dedicated to the professional and equine markets.
These sales teams deliver our marketing strategy that is consumer, brand and channel driven. We provide value creation with a focus on innovation, product quality and performance, premium packaging, product positioning and consumer value. We collaborate closely with our customers to identify their needs, jointly develop strategies to meet those needs and deliver programs that include digital execution, print, broadcast and direct mail. We continue to invest in talent, innovation, brand building, digital capabilities and eCommerce as these play a critical role in our ambition to lead in the pet segment.
Over the last two years we have received a number of awards for marketing. In fiscal 2022, Kaytee won two packaging design awards from Graphic Design USA for Kaytee Nutrisoft and Field + Forest by Kaytee. In fiscal 2021, the National Association of Container Distributors (NACD), recognized Farnam's Vetrolin packaging with a bronze award.
Pet Competition
The pet supplies industry is highly competitive and has experienced considerable consolidation. Our branded pet products compete against national and regional branded products and private label products produced by various suppliers. Our largest competitors in the product categories we participate in are Mars, Inc., Spectrum Brands and the J.M. Smucker Co. The Pet segment competes primarily on the basis of brand recognition, innovation, upscale packaging, quality and service. Our Pet segment’s sales and distribution network competes with Animal Supply Co., Phillips Pet Food & Supplies and a number of smaller local and regional distributors, with competition based on product selection, price, value-added services and personal relationships.
Garden Segment
Garden Overview
We are a leader in the consumer lawn and garden consumables market in the United States and offer both premium and value-oriented branded products. We also produce value brands at lower prices, including numerous private label brands. In addition, our Garden segment operates a manufacturing, sales and distribution network that strategically supports our brands.
6
Garden Industry Background
The garden industry includes consumables such as grass and other seeds, fertilizer, controls, live goods, wild bird products as well as soil and mulch, and durables such as landscaping and decorative products including pottery, outdoor furniture, water features, lighting, arches and trellises. The total lawn and garden consumables industry in the United States is estimated by Packaged Facts, The Freedonia Group, Numerator and internal estimates to be approximately $32 billion in annual retail sales in 2022, including grass and other seeds, fertilizer, controls, live goods, wild bird products as well as soil and mulch. We estimate the annual retail sales of the lawn and garden consumables market in the categories in which we participate to be approximately $31 billion.
The lawn and garden consumables market is highly concentrated with most products sold to consumers through a number of distribution channels, including home centers, mass merchants, independent nurseries and hardware stores. Home and garden centers and mass merchants typically carry multiple premium and value brands.
Long-Term Garden Industry Characteristics
The Freedonia Group expects the industry to continue to grow as lifestyle changes and shifts in demographics are creating new opportunities in gardening. The COVID-19 pandemic has impacted daily habits, with many people spending much more time at home. As such, outdoor living has become much more significant and increased the emphasis on creating a pleasant outdoor living space. A survey by Freedonia Group found that in the 12 months ending March 2021, 36% of consumers agreed that they spent more time on outdoor projects while 26% of consumers planted a food garden because of the pandemic. Among key outdoor living trends, millennials are increasingly interested in gardening as a leisure pursuit, with 70% of respondents indicating that they enjoy gardening. They have become the nation's largest group of gardeners, representing 29% of all gardeners. According to the National Association of Realtors, Millennials have become homeowners in large numbers; a shift accelerated by COVID-19, remote work and a steady increase in income. Their interest in natural and organic products is particularly benefiting products with a positive environmental profile. The Freedonia Group reports that nearly three quarters of gardeners believe that they have a personal responsibility to be environmentally friendly.
Branded Lawn and Garden Products
Our principal lawn and garden consumables product lines are grass seed, vegetable, herb and flower packet seed, wild bird products, insect control products, lawn and garden care products including fertilizers and live plants. Our Pennington brand is one of the largest in grass seed, wild bird feed and birding accessories. Ferry-Morse is a leader in vegetable, herb and flower packet seed and our Amdro brand is a leading portfolio of control products.
We continuously seek to introduce new products, both as complementary extensions of existing product lines and in new product categories. In fiscal 2022, we launched Pennington Smart Patch lawn products, ideal for patching bare lawn spots and thinning areas. In fiscal 2021, we relaunched Pennington Smart Seed® lawn products with patent-pending fertilizer-enhanced seed coating to speed seed establishment and promote greener grass. We also launched a variety of new bird feeders under our Pennington brand. We expanded our live plants offering with small decorated holiday products and introduced plantlings delivered directly to the consumers.
Controls. We are a leading marketer, producer and distributor of lawn and garden weed, moss, insect and pest control products. We sell these products under brands such as Amdro, Corry’s®, Daconil®, IMAGE, Knockout™, Lilly Miller®, Moss Out®, Over-N-Out®, Rootboost™ and Sevin as well as other private and controlled labels.
Grass Seed. We are a leading marketer, producer and distributor of numerous varieties and mixtures of cool and warm season grass seed for both the residential and professional markets, as well as forage and wildlife seed mixtures. We sell these products under the Pennington brand along with several sub-brands including Lawn Booster, One Step Complete®, Rackmaster®, Slopemaster®, Smart Seed, Smart Patch, The Rebels® and other brand names. We also produce numerous private label brands of grass seed. The Pennington grass seed manufacturing facilities are some of the largest and most modern seed coating and conditioning facilities in the industry.
Vegetable, Herb and Flower Seed. We are a leading provider of vegetable, herb and flower packet seeds and seed starters. We sell these products under the American Seed®, Ferry-Morse, Livingston®, McKenzie® Seed, Jiffy and other brand names.
Wild Bird. We are the leading producer, marketer and distributor of wild bird feed, bird feeders, bird houses and other birding accessories. These products are sold under the Pennington, Wild Delight® and 3-D® Pet Products brands. Many of our branded wild bird mixes are treated with a proprietary blend of vitamins and minerals. For example, our Pennington brand mixes are enriched with Bird-Kote®, our exclusive process which literally seals each seed with a nutritious coating containing vitamins and minerals that are beneficial to the health of wild birds.
Fertilizers. We are a leading producer, marketer and distributor of soil supplements and stimulants. We manufacture several lines of lawn and garden fertilizers and soil supplements in granular and liquid form under the Alaska® Fish Fertilizer, Ironite®, Pennington, Superthrive® and Pro Care® brand names and other private and controlled labels.
7
Live Plants. With Bell Nursery and Hopewell Nursery, we are the primary supplier of superior quality flowers, trees, shrubs and other plants to Home Depot in the Northeast and mid-Atlantic regions, producing and shipping tens of millions of annuals and perennials each year, also offering items we don’t grow, such as orchids and indoor plants.
Garden Sales and Distribution Network
Our sales and distribution network exists primarily to promote our proprietary brands and provides us with key access to retail stores for our branded products, acquisition and maintenance of premium shelf placement, prompt product replenishment, customization of retailer programs, quick responses to changing customer and retailer preferences, rapid deployment and feedback for new products, immediate exposure for acquired brands and comprehensive and strategic information. The network also sells other manufacturers’ brands of lawn and garden supplies and combines these products with our branded products into single shipments enabling over 4,400 customers and over 38,000 stores to deal with us on a cost-effective basis to meet their lawn and garden supplies requirements.
Garden Sales and Marketing
The marketing strategy for our premium products is focused on meeting consumer needs through product performance, innovation, quality, upscale packaging and retail shelf placement. The marketing strategy for our value products is focused on promotion of the quality and efficacy of our value brands at a lower cost relative to premium brands. Our customers include retailers, such as mass merchants, home improvement centers, independent lawn and garden nurseries, drug and grocery stores, and professional end users. Sales to Home Depot represented approximately 33% and 33%, sales to Walmart represented approximately 28% and 26% and sales to Lowe’s represented approximately 16% and 18% of our Garden segment’s net sales in fiscal 2022 and 2021, respectively.
To maximize our product placement and visibility in retail stores, we market our products through the following four complementary strategies:
•dedicated sales forces represent our combined brand groups;
•retail sales and logistics network, which provides in-store training and merchandising for our customers, especially during the prime spring and summer seasons;
•dedicated account-managers and sales teams located near several of our largest customers; and
•selected independent distributors who sell our brands.
We continue to invest in talent, digital capabilities and eCommerce as these play a critical role in our ambition to lead in the Garden segment.
Garden Competition
The lawn and garden consumables industry is highly competitive. Our lawn and garden products compete against national, regional and private label products produced by various suppliers. Our turf and forage grass seed products, fertilizers, pesticides and combination products compete principally against products marketed by The Scotts Miracle-Gro Company. In addition, Spectrum Brands and S.C. Johnson & Son, Inc. are strong competitors in yard and household insecticides. Our Garden segment competes primarily based on its strong premium and value brands, quality, service, price and low-cost manufacturing. Our Garden segment’s sales and distribution network also competes with a large number of distributors, with competition based on price and service.
Seasonality
While demand for our pet supplies products, except for pest controls, is generally balanced over the year, our lawn and garden consumables business is highly seasonal with approximately two thirds of net sales occurring in our second and third fiscal quarters combined. We build inventory based on expected demand and typically fill customer orders within a few days of receipt, so the backlog of unfilled orders is not material. Funding for working capital items, including inventory and receivables, is normally sourced from operating cash flows and short-term borrowings under our revolving credit facility. For additional information on our liquidity, working capital management, cash flow and financing activities, see Liquidity and Capital Resources, and Note 11, Long-Term Debt, appearing later in this Form 10-K.
Sources and Availability of Raw Materials
We purchase most of our raw materials from multiple suppliers. We obtain one of the raw materials used to manufacture (S)-Methoprene from a single source of supply. We maintain an inventory of this raw material (in addition to our (S)-Methoprene inventory) to reduce the possibility of interruption in the availability of (S)-Methoprene, since a prolonged delay in obtaining (S)-Methoprene or this raw material could result in a temporary delay in product shipments and have an adverse effect on our Pet segment’s financial results.
The key ingredients in our fertilizer and insect and weed control products are commodity and specialty chemicals, including urea, potash, phosphates, herbicides, insecticides and fungicides.
8
The principal raw materials required for our bird feed are bulk commodity grains, including millet, milo and sunflower seeds, which are generally purchased from large national commodity companies and local grain cooperatives. In order to ensure an adequate supply of grains and seed to satisfy expected production volume, we enter into contracts to purchase a portion of our expected grain and seed requirements at future dates by fixing the quantity, and often the price, at the commitment date. Although we have never experienced a severe interruption of supply, we are exposed to price risk with respect to the portion of our supply which is not covered by contracts with a fixed price.
The COVID-19 pandemic has caused a significant increase in demand for pet supplies and garden consumables. This has caused strain on our supply chain network and its ability to meet such demand. For information regarding the impact of changes in commodity prices, see “Risk Factors – The COVID-19 pandemic has impacted how we are operating our business, and the duration and extent to which this will impact our future results of operations and overall financial performance remains uncertain” and “Risk Factors – Seeds and grains we use to produce bird feed and grass seed are commodity products subject to price volatility that has had, and could have, a negative impact on us” in Item 1.A.
Patents, Trademarks and Other Proprietary Rights
We hold numerous patents in the United States and in other countries and have several patent applications pending. We consider the development of patents through creative research and the maintenance of an active patent program to be advantageous to our business, but do not regard any particular patent as essential to our operations. In addition to patents, we have numerous active ingredient registrations, end-use product registrations and trade secrets. Along with patents, active ingredient registrations, end use product registrations and trade secrets, we own numerous trademarks, service marks, trade names and logotypes. Many of our trademarks are registered but some are not.
Human Capital Management
We believe Central employees are part of our organization because they are passionate about the pet and garden industries. Every Central Team member and every job is important to our success and helping us to achieve our purpose.
As of September 24, 2022, we had approximately 7,000 employees, of whom approximately 6,400 were full-time employees and 600 were temporary or part-time employees. We also hire substantial numbers of additional temporary employees for the peak lawn and garden shipping season of February through June to meet the increased demand experienced during the spring and summer months. The majority of our temporary employees are paid on an hourly basis. Except for approximately 50 employees at a facility in Puebla, Mexico, none of our employees are represented by a labor union. The attrition rate of our non-seasonal full-time and part-time workforce was 36% in fiscal 2022.
We believe that attracting, developing and retaining a diverse and inclusive workforce is an important component to our continued success. We have taken several steps to further enhance our diversity, including the creation of a diversity and inclusion council. We consider gender, nationality, ethnicity, age, educational and professional background, among other things, in our recruiting and internal promotion decisions. Women serve in several senior leadership roles, holding 39% of leadership positions (defined as Managers, Directors and Senior leaders (Vice President and above), including Senior Vice President Human Resources, General Counsel and Secretary, Chief of Staff, Senior Vice President Pet Consumer Marketing, Vice President Accounting Operations, Vice President Investor Relations, Vice President Corporate Development, Vice President Real Estate, President Segrest, General Manager Health & Wellness and Vice President Pet Specialty Sales.
We recognize financial stability is a critical component to our employees’ well-being. Our competitive compensation programs include base salary or hourly compensation for all employees. In addition, we provide an annual 401k profit-sharing bonus program and a bonus program for eligible employees which is based on the success of our businesses as measured by designated performance metrics and individual performance contributions. Another component of our overall compensation program is long-term equity which is offered through annual and individual grants. We use such long-term equity grants as a means of attracting and retaining key employees to reward performance and to give these employees a vested interest in the success of the Company. Moreover, our physical health programs, like our medical and dental coverage, help our employees to feel their best on the job and at home.
Developing our employees so that they can assume key roles within Central is an important strategic priority for us. We offer a variety of programs and resources to train and enhance the skill set of our workforce, including subsidizing college and advanced degrees for eligible employees. We also engage in regular discussions around succession planning and talent development at all levels of the Company. Our Board has frequent contact with business leaders within the organization and participates actively in the succession planning process. Our Senior Vice President Human Resources reports directly to the Chief Executive Officer and works with management to evaluate internal talent for future leadership positions within the organization on an ongoing basis. In evaluating potential acquisitions, an important consideration is the quality of the management team of the target company and our ability to obtain sufficient assurance that such management will remain with Central as needed if and after we acquire the business.
We encourage and drive high standards in our safety performance by recording, reporting and investigating all incidents to root cause. In the ongoing push for progress, we set new annual safety targets and invest in our operational capabilities. In fiscal 2022, we were able to improve our recordable incident rate by 24% compared to fiscal 2021.
9
In February 2021, for the first time in the Company's history, Central was named as one of Forbes 2021 America’s Best Midsize Employers.
Regulatory Considerations
Many of the products that we manufacture or distribute are subject to local, state, federal and foreign laws and regulations. Such regulations are often complex and are subject to change. For example, in the United States, all pesticides must be registered with the United States Environmental Protection Agency (the “EPA”), in addition to individual state and/or foreign agency registrations before they can be sold. Fertilizer products are also subject to state Department of Agriculture registration and foreign labeling regulations. Grass and other seed are also subject to state, federal and foreign labeling regulations.
The Food Quality Protection Act ("FQPA") establishes a standard for food-use pesticides, which is a reasonable certainty that no harm will result from the cumulative effect of pesticide exposures. Under this Act, the EPA is evaluating the cumulative risks from dietary and non-dietary exposures to pesticides. The pesticides in our products, which are also used on foods, are evaluated by the EPA as part of this non-dietary exposure risk assessment.
In addition, the use of certain pesticide and fertilizer products is regulated by various local, state, federal and foreign environmental and public health agencies. These regulations may include requirements that only certified or professional users apply the product or that certain products be used only on certain types of locations (such as “not for use on sod farms or golf courses”), may require users to post notices on properties to which products have been or will be applied, may require notification of individuals in the vicinity that products will be applied in the future or may ban the use of certain ingredients.
Various federal, state and local laws, including the federal Food Safety Modernization Act (“FSMA”), also regulate pet food products and give regulatory authorities the power to recall or require re-labeling of products. Several new FSMA regulations became effective in recent years.
Various local, state, federal and foreign environmental laws also impose obligations on various entities to clean up contaminated properties or to pay for the cost of such remediation, often upon parties that did not actually cause the contamination. In the course of our extensive acquisition history, we have acquired a number of manufacturing and distribution facilities, and most of these facilities have not been subjected to Phase II environmental tests to determine whether they are contaminated.
Environmental, Social and Governance
The long-term profitability of our business requires us to do our part to protect the planet, care for the local areas we serve, and provide our Central employees a safe, healthy and rewarding workplace. Sustainability is embedded throughout our long-term enterprise roadmap, and brought to life through our Central Impact strategy. We demonstrated our commitment to sustainability by publishing our first Central Impact Report in fiscal 2022. This inaugural report provides detailed information on our Central Impact strategy, our focus areas - protecting our planet, cultivating our communities and empowering our employees, and we have set goals in 10 critical areas - energy & greenhouse gases, water, waste, biodiversity, philanthropy, employee volunteering, product stewardship, health & safety, diversity & inclusion, learning & development - and our progress and examples of our commitment in action. The report can be found on our website www.central.com.
Information About Our Executive Officers
The following table sets forth the name, age and position of our executive officers as of November 21, 2022.
| Name | 1 | Age | Position | |||||||||||
| William E. Brown | 81 | Chairman of the Board | ||||||||||||
| Timothy P. Cofer | 54 | Chief Executive Officer | ||||||||||||
| John E. Hanson | 57 | President, Pet Consumer Products | ||||||||||||
| Nicholas Lahanas | 54 | Senior Vice President, Chief Financial Officer | ||||||||||||
| J.D. Walker | 64 | President, Garden Consumer Products | ||||||||||||
| Joyce McCarthy | 53 | General Counsel and Secretary | ||||||||||||
William E. Brown. Mr. Brown has been our Chairman since October 2019, having also served in this capacity from 1980 to 2018. From 1980 to June 2003 and from October 2007 to February 2013, he served as our Chief Executive Officer. From 1977 to 1980, Mr. Brown was Senior Vice President of the Vivitar Corporation with responsibility for Finance, Operations and Research & Development. From 1972 to 1977, he was with McKesson Corporation where he was responsible for its 200-site data processing organization. Prior to joining McKesson Corporation, Mr. Brown spent the first 10 years of his business career at McCormick, Inc. in manufacturing, engineering and data processing.
10
Timothy P. Cofer. Mr. Cofer became our Chief Executive Officer in October 2019. He is a 30-year veteran of the Consumer Products industry. Most recently, from 2016 to 2019 he served as Executive Vice President and Chief Growth Officer of Mondelez International. Previously he served as Executive Vice President and President of Asia Pacific, Eastern Europe, Middle East & Africa of Mondelez, Inc. Prior to that, Mr. Cofer served in senior-level operating roles at Kraft Foods, Inc., including Executive Vice President and President of European Region, President of Oscar Mayer Foods and President of Kraft Pizza Company.
John E. Hanson. Mr. Hanson became our President of Pet Consumer Products in August 2019 after serving as a board member during portions of 2018 and 2019. From 2015 to 2017, he served as Chief Executive Officer of Oasis Brands, Inc. Beginning in 2013, Mr. Hanson consulted for consumer products companies in the areas of strategy, operations and mergers and acquisitions. Prior to that, he had over 16 years of experience at ConAgra, where he served in a variety of senior-level roles including President of its Frozen Foods Division from 2008 to 2012 and Senior Vice President in Sales from 2006 to 2008.
Nicholas "Niko" Lahanas. Mr. Lahanas became our Chief Financial Officer in May 2017. He served as Senior Vice President of Finance and Chief Financial Officer of our Pet segment from April 2014 to May 2017 and Vice President of Corporate Financial Planning & Analysis from October 2011 to March 2014. Mr. Lahanas was the Director of Business Performance from March 2008 to October 2011, where his primary focus was on business unit profitability, and was a Finance Manager from October 2006 to March 2008 in our Garden segment. Prior to joining Central, he worked in private equity and investment banking.
J.D. Walker. Mr. Walker became our President of Garden Consumer Products in 2017 and has responsibility for Central's branded garden business including sales, marketing operations, the controls and fertilizer, grass seed and vendor partner business units, as well as the retail sales & service team and garden distribution. Prior to his promotion, he served as Executive Vice President and General Manager - Garden Branded Business from 2014 to 2017 and began with Central as Senior Vice President - Garden Sales in 2011. Prior to joining Central, Mr. Walker held increasingly senior positions for 13 years with Spectrum Brands and for 17 years with The Gillette Company's Duracell North American Group.
Joyce McCarthy. Ms. McCarthy became our General Counsel and Secretary in April 2022. From 2018-2022, she served as General Counsel & Secretary for Ferrara Candy Company where she oversaw all legal and compliance matters for the company. From 2002 to 2018, Ms. McCarthy held several key legal roles at Colgate-Palmolive Company, including four years as General Counsel of Hill’s Pet Nutrition, Inc., Colgate’s global pet food division. Prior to joining Colgate, Ms. McCarthy was an associate at Davis Polk & Wardwell and served as a law clerk to a U.S. District Court judge in the Southern District of New York.
Available Information
Our web site is www.central.com. We make available free of charge, on or through our website, our annual, quarterly and current reports, and any amendments to those reports, as soon as reasonably practicable after electronically filing or furnishing such reports with the Securities and Exchange Commission. Information contained on our web site is not part of this report.
11
Item 1A. Risk Factors.
This Form 10-K contains forward-looking statements that involve risks and uncertainties. Our actual results could differ materially from those anticipated in these forward-looking statements as a result of factors both in and out of our control, including the risks faced by us described below and elsewhere in this Form 10-K.
You should carefully consider the risks described below. In addition, the risks described below are not the only ones facing us. We have only described the risks we consider to be material. However, there may be additional risks that are viewed by us as not material at the present time or are not presently known to us. Conditions could change in the future, or new information may come to our attention that could impact our assessment of these risks.
If any of the events described below were to occur, our business, prospects, financial condition and/or results of operations could be materially adversely affected. When we say below that something could or will have a material adverse effect on us, we mean that it could or will have one or more of these effects. In any such case, the price of our common stock could decline, and you could lose all or part of your investment in our company.
Risks Affecting our Business
Inflation, rising interest rates, economic uncertainty, including a potential recession, and other adverse macro-economic conditions may harm our business.
Our revenues and margins are dependent on various economic factors, including rates of inflation, interest rates, the potential of an upcoming economic recession, energy costs, consumer attitudes toward discretionary spending, currency fluctuations, and other macro-economic factors which may impact consumer spending. During both fiscal 2021 and fiscal 2022, we experienced high levels of inflation resulting in significant cost increases in many parts of our business, including input costs, labor costs, and fuel costs. We expect the inflationary environment to continue during fiscal 2023 and some economist predict that the U.S. economy may enter an economic recession. If we are unable to pass through rising input costs and raise the price of our products, or consumer confidence and purchasing weakens, we may experience organic sales declines and gross margin and operating income declines.
High energy prices could adversely affect our operating results.
During fiscal 2021 and fiscal 2022, energy prices increased substantially and have remained elevated, which resulted in increased fuel costs for our businesses and increased raw materials costs for many of our products, and may continue to rise during fiscal 2023. Continued high energy prices in the future could adversely affect consumer spending and demand for our products and increase our operating costs, both of which would reduce our sales and operating income.
A decline in consumers’ discretionary spending or a change in consumer preferences during economic downturns could reduce our sales and harm our business.
Our sales ultimately depend on consumer discretionary spending, which is influenced by factors beyond our control, including the current inflationary environment, rising interest rates, the potential for an upcoming economic recession, other general economic conditions, the availability of discretionary income and credit, weather, consumer confidence and unemployment levels. Any material decline in consumer discretionary spending during the economic downturn could reduce our sales and harm our business. Unfavorable economic and market conditions may also place a number of our key retail customers under financial stress, which would increase our credit risk and potential bad debt exposure.
The success of our business also depends in part on our ability to identify and respond to evolving trends in demographics and consumer preferences. Our failure to timely identify or effectively respond to changing consumer tastes, preferences, spending patterns and lawn and garden and pet care needs could adversely affect the demand for our products and our profitability.
The COVID-19 pandemic has impacted how we are operating our business, and the duration and extent to which this will impact our future results of operations and overall financial performance remains uncertain.
The outbreak of the global COVID-19 pandemic in fiscal 2020 has impacted our day-to-day operations and the operations of the vast majority of our customers, suppliers, and consumers. While the availability and accessibility of vaccines and boosters in the U.S. reduced the impact of COVID-19 in fiscal 2022, COVID-19 and its new variants may continue to affect how we and our customers are operating our businesses and overall demand for our products.
12
We have experienced varying impacts to our Garden and Pet businesses due to COVID-19. Many of our product categories in both Pet and Garden benefited from increased pet adoption during the pandemic and stay at home orders and remote working that positively impacted demand for our products. We have also seen an increase in demand in the eCommerce channel.
The pandemic and increase in demand for our products created operational challenges for our distribution network and impacted our ability to meet our normal fill rate standards. Our supply chain was also impacted by the rapid increase in demand, and we experienced increased operational and logistics costs. During fiscal 2022, we increased inventories to mitigate the impact of supply chain shortages and improve fill rates, which increased carrying costs. We may experience additional disruptions in our supply chain if the pandemic worsens, though we cannot reasonably estimate the potential impact or timing of those events.
As fiscal 2022 progressed, the impact of the pandemic lessened and high inflation continued, negatively impacting consumer purchasing behavior and resulting in higher levels of inventory at our customers and at Central. If we are not able to respond to and manage the impact of such events effectively, our business will be harmed.
Our operating results and cash flow are susceptible to fluctuations.
We expect to continue to experience variability in our net sales, net income and cash flow on a quarterly basis. Factors that may contribute to this variability include:
•high inflation and the ability to take pricing actions to mitigate high input costs, including for commodities;
•the uncertain macro-economic environment, including rising interest rates and a potential recession, and the impact either could have on consumer discretionary spending;
•seasonality and adverse weather conditions;
•fluctuations in prices of commodity grains and other input costs;
•supply chain and sourcing disruptions, including due to the COVID-19 pandemic and the volatile geopolitical environment;
•shifts in demand for lawn and garden and pet products;
•changes in product mix, service levels, marketing and pricing by us and our competitors;
•the effect of acquisitions; and
•the strength of our relationships with key retailers and their buying patterns and economic stability.
These fluctuations could negatively impact our business and the market price of our common stock.
We are in the process of implementing our Central to Home strategy, which could result in increased expenses over the next few years.
After we embarked on a company-wide strategic review led by our Chief Executive Officer, we developed our Central to Home strategy, which consists of a comprehensive series of organizational and operational initiatives intended to build and grow our consumer brands, create a leading eCommerce platform and strengthen our relationships with key customers, drive a strong portfolio strategy, reduce costs to improve margins and fuel growth and strengthen our entrepreneurial, business unit-led growth culture. We expect to continue to implement these initiatives over the next several years. We anticipate continuing to incur substantial costs relating to this strategy in each of the next several years. There can be no assurance that we will be able to successfully execute our Central to Home strategic initiatives or that we will be able to do so within the anticipated time period. During the process of implementation, we will be making substantial investments in our business and will incur substantial transitional costs. These investments and transitional costs may adversely affect our operating results.
Seeds and grains we use to produce bird feed and grass seed are commodity products subject to price volatility that has had, and could have, a negative impact on us.
Our financial results are partially dependent upon the cost of raw materials and our ability to pass along increases in these costs to our customers. In particular, our Pennington and Kaytee businesses are exposed to fluctuations in market prices for commodity seeds and grains used to produce bird feed. Historically, market prices for commodity seeds and grains have fluctuated in response to a number of factors, including changes in U.S. government farm support programs, changes in international agricultural and trading policies and weather conditions during the growing and harvesting seasons.
To mitigate our exposure to changes in market prices, we enter into purchase contracts for grains, bird feed and grass seed to cover a limited portion of our purchase requirements for a selling season. Since these contracts cover only a portion of our purchase requirements, as
13
market prices for such products increase, our cost of production increases as well. In contrast, if market prices for such products decrease, we may end up purchasing grains and seeds pursuant to the purchase contracts at prices above market.
Fiscal 2022 brought historic levels of inflation and reduced supply of certain grains due to the war in Ukraine, which drove up costs for bird feed and grass seed. In both fiscal 2021 and fiscal 2022, we experienced increasing inflationary costs in key commodities (e.g., sunflower, milo and millet). Although we were able to negotiate further price increases in fiscal 2022 with our retailers, it is possible that price increases may not fully offset continued high costs in the future, resulting in margin erosion. We can provide no assurance as to the timing or extent of our ability to implement additional price adjustments in the event of continued high costs in the future, or our ability to maintain pricing with our retailers in the context of declining costs. We also cannot predict to what extent price increases may negatively affect our sales volume. As retailers pass along price increases, consumers may shift to our lower margin bird feed, switch to competing products or reduce purchases of wild bird feed products. The same shift in consumer behavior could adversely affect our business in other product categories which experience substantial price increases.
Supply chain delays and interruptions may result in lost sales, reduced fill rates and service levels and delays in expanding capacity and automating processes.
The COVID-19 pandemic and the rapid increase in demand for our products created operational challenges for our distribution network which impacted our service and fill rates and resulted in lost sales. In fiscal 2020 and fiscal 2021, the increased demand for our products challenged our supply chain and our ability to procure and manufacture enough product to meet the high levels of demand. As fiscal 2022 progressed, demand for our products stabilized as did the availability of materials and labor, while inflation rose at unprecedented levels, resulting in increased costs for key commodities, materials, labor and freight.
We may experience additional disruptions in our supply chain, whether due to the ongoing COVID-19 pandemic or the volatile geopolitical environment, which would impact our ability to procure the materials needed for manufacture or our ability to ship our products to our customers. We cannot reasonably estimate the potential impact or timing of those events, and we may not be able to mitigate such impact.
We are subject to significant risks associated with innovation, including the risk that our new product innovations will not produce sufficient sales to recoup our investment.
We believe that our future success will depend upon, in part, our ability to continue to improve our existing products through product innovation and to develop, market and produce new products. We cannot assure you that we will be successful in the introduction, marketing and production of any new products or product innovations, or that we will develop and introduce in a timely manner, improvements to our existing products which satisfy customer needs or achieve market acceptance. Our failure to develop new products or improved formulations and introduce them successfully and in a timely manner could harm our ability to grow our business and could have a material adverse effect on our business, results of operations and financial condition.
We believe that the period of time to gain consumer acceptance of major innovations is longer in the garden industry than in many industries, which compounds the risks generally associated with major new product innovations.
Supply disruptions in pet birds, small animals and fish may negatively impact our sales.
The federal government and many state governments have increased restrictions on the importation of pet birds and the supply of small animals. These restrictions have resulted in reduced availability of new pet birds and small animals and thus reduced demand for pet bird and small animal food and supplies. If these restrictions become more severe, or similar restrictions become applicable to pet fish, our future sales of these products would likely suffer, which would negatively impact our profitability. In addition, some countries have experienced outbreaks of avian flu. A significant outbreak in the United States would reduce demand for our pet and wild bird food and negatively impact our financial results.
Our Segrest subsidiary is the largest supplier of aquarium fish in the United States and also supplies pet birds and small animals. The sale of fish, pet birds and small animals subjects us to additional risk, including risks associated with sourcing, developing captive breeding programs, health of the fish, pet birds and small animals supplied by us and future governmental regulation of the sale of fish, pet birds and small animals.
Our lawn and garden sales are highly seasonal and subject to adverse weather.
Because our lawn and garden products are used primarily in the spring and summer, the Garden business is seasonal. In fiscal 2022, approximately 66% of our Garden segment’s net sales and 59% of our total net sales occurred during our second and third fiscal quarters. Substantially all of the Garden segment’s operating income is generated in this period. Our working capital needs and our borrowings generally peak in our second fiscal quarter because we are generating lower revenues while incurring expenses in preparation for the spring selling season. If cash on hand and borrowings under our credit facility are ever insufficient to meet our seasonal needs or if cash flow
14
generated during the spring and summer is insufficient to repay our borrowings on a timely basis, this seasonality could have a material adverse effect on our business.
Because demand for lawn and garden products is significantly influenced by weather, particularly weekend weather during the peak gardening season, our results of operations and cash flow could also be adversely affected by certain weather patterns such as unseasonably cool or warm temperatures, heavy rains, water shortages or floods. During fiscal 2022, we experienced unfavorable weather during the peak garden season, which adversely impacted our Garden sales. Unfavorable weather in the future could have a significant adverse effect on the sales and profitability of our lawn and garden business.
We depend on a few customers for a significant portion of our business.
Walmart, our largest customer, represented approximately 17% of our total company net sales in fiscal 2022, 16% in fiscal 2021 and 17% in fiscal 2020. Home Depot, our second largest customer, represented approximately 16%, 15% and 13% of our total company net sales in fiscal 2022, 2021 and 2020, respectively. Lowe's, our third largest customer, represented approximately 8%, 9% and 10% of our total company net sales in fiscal 2022, 2021 and 2020, respectively. Costco and Amazon are also significant customers, and together with Walmart, Home Depot and Lowe's accounted for approximately 51% of our net sales in fiscal 2022. The market shares of many of these key retailers have increased and may continue to increase in future years.
The loss of, or significant adverse change in, our relationship with any of these key retailers could cause our net sales, operating income and cash flow to decline. The loss of, or reduction in, orders from any significant customer, losses arising from customer disputes regarding shipments, fees, merchandise condition or related matters, or our inability to collect accounts receivable from any major customer could reduce our operating income and cash flow.
Tariffs or a global trade war could increase the cost of our products, which could adversely impact the competitiveness of our products and our financial results.
During the former presidential administration, the United States imposed a series of tariffs, ranging from 5% to 25%, on a variety of imports from China and subsequently implemented tariffs on additional goods imported from China. Less than 10% of the products that we sell are manufactured in China. If the United States continues the China tariffs, or if additional tariffs or trade restrictions are implemented by the United States or other countries in connection with a global trade war, the cost of our products manufactured in China, or other countries, and imported into the United States could increase, which in turn could adversely affect the demand for these products and have a material adverse effect on our business and results of operations.
We may be adversely affected by trends in the retail industry.
Our retailer customers have continued to consolidate, resulting in fewer customers on which we depend for business. These key retailers are increasingly large and sophisticated with increased buying power and negotiating strength who are more capable of resisting price increases and who can demand lower pricing. Our business may be negatively affected by changes in the policies of our key retailers, such as limitations on access to shelf space, price demands and other conditions. In addition, large retailers have the scale to develop supply chains that permit them to operate with reduced inventories. Consequently, our customers have been implementing inventory destocking and making purchases on a “just-in-time” basis. This requires us to shorten our lead time for production in certain cases and to more closely anticipate demand, which could in the future require the carrying of additional inventories and an increase in our working capital and related financing requirements. This shift to “just-in-time” can also cause retailers to delay purchase orders, which can cause a shift in sales from quarter to quarter. Decisions to move in or out of a market category by leading retailers, such as Walmart's decision to exit the live fish business in 2019, can also have a significant impact on our business. Additionally, some retailers are increasing their emphasis on private label products. These retailers may also in the future use more of their shelf space, currently used for our products, for their store brand products. While we view private label as an opportunity and supply many private label products to retailers, we could lose sales in the event that key retailers replace our branded products with private label product manufactured by others.
We sell our products through a variety of trade channels with a significant portion dependent upon key retailers, through both traditional brick-and-mortar retail channels and eCommerce channels, including Amazon. The eCommerce channel continues to grow rapidly. To the extent that the key retailers on which we depend lose share to the eCommerce channel, we could lose sales. We continue to make additional investments to access this channel more effectively, but there can be no assurances that any such investments will be successful. If we are not successful in developing and utilizing eCommerce channels that consumers may prefer, we may experience lower than expected revenues.
A significant deterioration in the financial condition of one of our major customers could have a material adverse effect on our sales, profitability and cash flow. We continually monitor and evaluate the credit status of our customers and attempt to adjust sales terms as appropriate. Despite these efforts, a bankruptcy filing or liquidation by a key customer could have a material adverse effect on our business, results of operations and financial condition in the future.
15
If we underestimate or overestimate demand for our products and do not maintain appropriate inventory levels, our results of operations and financial condition could be negatively impacted.
Our ability to manage our inventory levels to meet our customers’ demand for our products is important for our business. Our production levels and inventory management goals for our products are based on estimates of demand, taking into account production capacity, timing of shipments, and inventory levels. To mitigate the adverse impact of supply chain disruptions on our fill rates, we increased our inventory levels significantly during fiscal 2022. If we overestimate or underestimate demand for any of our products during a given season, we may not maintain appropriate inventory levels, which could negatively impact our net sales, profit margins, net earnings, and/or working capital, hinder our ability to meet customer demand, result in loss of customers, or cause us to incur excess and obsolete inventory charges.
Issues with products may lead to product liability, personal injury or property damage claims, recalls, withdrawals, replacements of products, regulatory actions by governmental authorities that could divert resources, affect business operations, decrease sales, increase costs, and put us at a competitive disadvantage, any of which could have a significant adverse effect on our results of operations and financial condition.
We have experienced, and may in the future experience, issues with products that may lead to product liability, recalls, withdrawals, replacements of products, or regulatory actions by governmental authorities. Product recalls or other governmental regulatory action directed at product sales could result in increased governmental scrutiny, reputational harm, reduced demand by consumers for our products, decreased willingness by retailer customers to purchase or provide marketing support for those products, unavailability or increased cost of insurance, or additional safety and testing requirements. Such results could divert development and management resources, adversely affect our business operations, decrease sales, increase legal fees and other costs, and put us at a competitive disadvantage compared to other manufacturers not affected by similar issues with products, any of which could have a significant adverse effect on our results of operations and financial condition.
Competition in our industries may hinder our ability to execute our business strategy, increase our profitability or maintain relationships with existing customers.
We operate in highly competitive industries, which have experienced increased consolidation in recent years. We compete against numerous other companies, some of which are more established in their industries and have substantially greater revenue and resources than we do. Our products compete against national and regional products and private label products produced by various suppliers. Our largest competitors in the Pet segment are Spectrum Brands, Hartz Mountain, Mars, Inc. and the J.M Smucker Co., and our largest competitors in the Garden segment are Scotts Miracle-Gro, Spectrum Brands and S.C. Johnson.
To compete effectively, among other things, we must:
•develop and grow brands with leading market positions;
•maintain or grow market share;
•maintain and expand our relationships with key retailers;
•effectively access the growing eCommerce channel;
•continually develop innovative new products that appeal to consumers;
•implement effective marketing and sales promotion programs;
•maintain strict quality standards;
•deliver products on a reliable basis at competitive prices; and
•effectively integrate acquired businesses.
Competition could lead to lower sales volumes, price reductions, reduced profits, losses, or loss of market share. Our inability to compete effectively could have a material adverse effect on our business, results of operations and financial condition.
16
We continue to implement enterprise resource planning information technology systems.
We are incurring costs associated with designing and implementing enterprise resource planning (ERP) software systems with the objective of gradually migrating our businesses to one or the other of two systems. The choice of which is to be used for each business is dependent on the needs of the business unit. These two systems are expected to replace numerous accounting and financial reporting systems, most of which have been obtained in connection with business acquisitions. To date, we have reduced the number of ERP systems from 43 to 12. Capital expenditures for our enterprise resource planning software systems for fiscal 2023 and beyond will depend upon the pace of conversion for those remaining legacy systems. If the balance of the implementation is not executed successfully, we could experience business interruptions. If we do not complete the implementation of the project timely and successfully, we may experience, among other things, additional costs associated with completing this project and a delay in our ability to improve existing operations, support future growth and take advantage of new applications and technologies. All of this may also result in distraction of management, diverting their attention from our operations and strategy.
Some of the products that we manufacture and distribute require governmental permits and also subject us to potential environmental liabilities.
Some of the products that we manufacture and distribute are subject to regulation by federal, state, foreign and local authorities. Environmental health and safety laws and regulations are often complex and are subject to change. Environmental health and safety laws and regulations may affect us by restricting the manufacture, sale or use of our products or regulating their disposal. Regulatory or legislative changes may cause future increases in our operating costs or otherwise affect operations. There is no assurance that in the future we may not be adversely affected by such laws or regulations, incur increased operating costs in complying with such regulations or not be subject to claims for personal injury, property damages or governmental enforcement. In addition, due to the nature of our operations and the frequently changing nature of environmental compliance standards and technology, we cannot predict with any certainty that future material capital expenditures will not be required.
In addition to operational standards, environmental laws also impose obligations on various entities to clean up contaminated properties or to pay for the cost of such remediation, often upon parties that did not actually cause the contamination. Accordingly, we may become liable, either contractually or by operation of law, for remediation costs even if the contaminated property is not presently owned or operated by us, or if the contamination was caused by third parties during or prior to our ownership or operation of the property. With our extensive acquisition history, we have acquired a number of manufacturing and distribution facilities, and most of these facilities have not been subjected to Phase II environmental tests to determine whether they are contaminated. Given the nature of the past operations conducted by us and others at these properties, there can be no assurance that all potential instances of soil or groundwater contamination have been identified, even for those properties where an environmental site assessment has been conducted. Future events, such as changes in existing laws or policies or their enforcement, or the discovery of currently unknown contamination, may give rise to future remediation liabilities that may be material.
Our business is dependent upon our ability to continue to source products from China.
We outsource a portion of our manufacturing requirements to third-party manufacturers located in China. This subjects us to a number of risks, including: the impact of Chinese public health and contamination risks on manufacturing; quality control issues; social and political disturbances and instability; export duties, import controls, tariffs, quotas and other trade barriers; shipping and transportation problems; and fluctuations in currency values. These risks may be heightened by changes in the U.S. government's trade policies, including the continuation of tariffs on goods imported from China or the imposition of any new tariffs. Because we rely on Chinese third-party manufacturers for a significant portion of our product needs, any disruption in our relationships with these manufacturers could adversely affect our operations.
Deterioration in operating results could prevent us from fulfilling our obligations under the terms of our indebtedness or impact our ability to refinance our debt on favorable terms as it matures.
We have, and we will continue to have, significant indebtedness. As of September 24, 2022, we had total indebtedness of approximately $1.2 billion. This level of indebtedness and our future borrowing needs could have material adverse consequences for our business, including:
•make it more difficult for us to satisfy our obligations with respect to the terms of our indebtedness;
•require us to dedicate a large portion of our cash flow to pay principal and interest on our indebtedness, which would reduce the availability of our cash flow to fund working capital, capital expenditures, acquisitions and other business activities;
•increase our vulnerability to adverse industry conditions, including unfavorable weather conditions or commodity price increases;
•limit our flexibility in planning for, or reacting to, changes in our business and the industries in which we operate;
•restrict us from making strategic acquisitions or exploiting business opportunities;
17
•place us at a competitive disadvantage compared to competitors that have less debt; and
•limit our ability to borrow additional funds at reasonable rates, if at all.
In addition, since our credit facility bears interest at variable rates, a further increase in interest rates or interest rate margins as defined under our credit agreement will create higher debt service requirements, which would adversely affect our cash flow.
Risks Relating to Acquisitions
Our acquisition strategy involves a number of risks.
We are regularly engaged in acquisition discussions with other companies and anticipate that one or more potential acquisition opportunities, including those that would be material or could involve businesses with operating characteristics that differ from our existing business operations, may become available in the near future. If and when appropriate acquisition opportunities become available, we intend to actively pursue them. Acquisitions involve a number of special risks, including:
•failure of the acquired business to achieve expected results, as well as the potential impairment of the acquired assets if operating results decline after acquisition;
•diversion of management’s attention;
•additional financing, if necessary and available, which could increase leverage and costs, dilute equity, or both;
•the potential negative effect on our financial statements from the increase in goodwill and other intangibles;
•difficulties in integrating the operations, systems, technologies, products and personnel of acquired companies;
•initial dependence on unfamiliar supply chains or relatively small supply partners;
•the potential loss of key employees, customers, distributors, vendors and other business partners of the companies we acquire after the acquisition;
•the high cost and expenses of identifying, negotiating and completing acquisitions; and
•risks associated with unanticipated events or liabilities.
These risks could have a material adverse effect on our business, results of operations and financial condition.
We have faced, and expect to continue to face, intense competition for acquisition candidates, which may limit our ability to make acquisitions and may lead to higher acquisition prices. We cannot assure you that we will be able to identify, acquire or manage profitably additional businesses or to integrate successfully any acquired businesses into our existing business without substantial costs, delays or other operational or financial difficulties. In future acquisitions, we also could incur additional indebtedness or pay consideration in excess of fair value, which could have a material adverse effect on our business, results of operations and financial condition.
If our goodwill, indefinite-lived intangible assets or other long-term assets become impaired, we will be required to record impairment charges, which may be significant.
A significant portion of our long-term assets consists of goodwill and other intangible assets recorded as a result of past acquisitions. We do not amortize goodwill and indefinite-lived intangible assets, but rather review them for impairment on a periodic basis or whenever events or changes in circumstances indicate that their carrying value may not be recoverable. We consider whether circumstances or conditions exist which suggest that the carrying value of our goodwill and other long-lived intangible assets might be impaired. If such circumstances or conditions exist, further steps are required to determine whether the carrying value of each of the individual assets exceeds its fair value. If analysis indicates that an individual asset’s carrying value does exceed its fair value, we would record a loss equal to the excess of the individual asset’s carrying value over its fair value.
The steps required by Generally Accepted Accounting Principles (GAAP) entail significant amounts of judgment and subjectivity. Events and changes in circumstances that may indicate that there may be an impairment and that interim impairment testing is necessary include, but are not limited to: competitive conditions; the impact of the economic environment on our customer base and on broad market conditions that drive valuation considerations by market participants; our internal expectations with regard to future revenue growth and the assumptions we make when performing impairment reviews; a significant decrease in the market value of our assets; a significant adverse change in the extent or manner in which our assets are used; a significant adverse change in the business climate that could affect our assets; and significant changes in the cash flows associated with an asset. As a result of such circumstances, we may be required to record a significant charge to earnings in our financial statements during the period in which any impairment of our goodwill, indefinite-lived intangible assets or other long-term assets is determined. Any such impairment charges could have a material adverse effect on our results of operations and financial condition.
18
During fiscal 2022, 2021 and 2020, we performed evaluations of the fair value of our indefinite-lived trade names and trademarks. Our expected revenues were based on our future operating plan and estimates of market growth or decline for future years. There were no impairment losses recorded in fiscal years 2020, 2021 and 2022.
In connection with our annual goodwill impairment testing performed during fiscal years 2022, 2021 and 2020, we made a qualitative evaluation about the likelihood of goodwill impairment to determine whether it was necessary to calculate the fair values of our reporting units under the quantitative goodwill impairment test. We completed our qualitative assessment of potential goodwill impairment and it was determined that it was more likely than not the fair values of our reporting units were greater than their carrying amounts, and accordingly, no quantitative testing of goodwill was required.
General Risks
Our success depends upon our retaining and recruiting key personnel.
Our performance is substantially dependent upon the continued services of Timothy P. Cofer, our Chief Executive Officer, and our senior management team. The loss of the services of these persons could have a material adverse effect on our business. Our future performance depends on our ability to attract and retain skilled employees in all facets of our business, including management and manufacturing and distribution. We cannot assure you that we will be able to retain our existing personnel or attract additional qualified employees in the future.
Our inability to protect our trademarks and any other proprietary rights may have a significant, negative impact on our business.
We consider our trademarks to be of significant importance in our business. Although we devote resources to the prosecution, protection and enforcement of our trademarks, we cannot assure you that the actions we have taken or will take in the future will be adequate to prevent infringement of our trademarks and proprietary rights by others or prevent others from seeking to block sales of our products as an alleged infringement of their trademarks and proprietary rights. There can be no assurance that future litigation will not be necessary to enforce our trademarks or proprietary rights or to defend ourselves against claimed infringement or the rights of others. Any future litigation of this type could result in adverse determinations that could have a material adverse effect on our business, financial condition or results of operations. Our inability to use our trademarks and other proprietary rights could also harm our business and sales through reduced demand for our products and reduced revenues.
The products that we manufacture and distribute could expose us to product liability claims.
Our business exposes us to potential product liability risks in the manufacture and distribution of certain of our products. Although we generally seek to insure against such risks, there can be no assurance that coverage will be adequate or that we will be able to maintain such insurance on acceptable terms. A successful product liability claim in excess of our insurance coverage could have a material adverse effect on us and could prevent us from obtaining adequate product liability insurance in the future on commercially reasonable terms.
We have unresolved litigation which could adversely impact our operating results.
We are a party to litigation alleging that the applicator developed and used by us for certain of our branded topical flea and tick products infringes a patent held by Nite Glow Industries, Inc. and asserting claims for breach of contract and misappropriation of confidential information. On June 27, 2018, a jury returned a verdict in favor of Nite Glow on each of the three claims and awarded damages of approximately $12.6 million, which was reduced to $12.4 million. We filed our notice of appeal and the plaintiffs cross-appealed. On July 14, 2021, the Federal Circuit Court of Appeals concluded that the Company did not infringe plaintiff's patent and determined that the breach of contract claim raised no non-duplicative damages and should be dismissed. The court affirmed the jury's liability verdict on the misappropriation of confidential information claim but ordered a new trial on damages on that single claim limited to the "head start" benefit, if any, generated by the confidential information. We intend to vigorously pursue our defenses in the future proceedings and believe that we will prevail on the merits as to the head start damages issue. While we believe that the ultimate resolution of this matter will not have a material impact on our consolidated financial statements, the outcome of litigation is inherently uncertain and the final resolution of this matter may result in expense to us in excess of management's expectations.
We are subject to cyber security risks and may incur increasing costs in an effort to minimize those risks.
Our business employs systems and websites that allow for the secure storage and transmission of proprietary or confidential information regarding our customers, employees, suppliers and others, including personally identifiable information. Security breaches could expose us to a risk of loss or misuse of this information, litigation, and potential liability. We may not have the resources or technical sophistication to anticipate or prevent rapidly-evolving types of cyber attacks. Attacks may be targeted at us, our customers and suppliers, or
19
others who have entrusted us with information. Actual or anticipated attacks may cause us to incur increasing costs, including costs to deploy additional personnel and protection technologies, train employees, and engage third-party experts and consultants. Advances in computer capabilities, new technological discoveries, or other developments may result in the technology used by us to protect transaction or other data being breached or compromised. In addition, data and security breaches can also occur as a result of non-technical issues, including breach by us or by persons with whom we have commercial relationships that result in the unauthorized release of personal or confidential information. Any compromise or breach of our security could result in a violation of applicable privacy and other laws, significant legal and financial exposure, and a loss of confidence in our security measures, which could have an adverse effect on our results of operations and our reputation.
Risks Relating to our Capital Stock
We do not expect to pay dividends in the foreseeable future.
We have never paid any cash dividends on our common stock or Class A common stock and currently do not intend to do so. Provisions of our credit facility and the indenture governing our senior subordinated notes restrict our ability to pay cash dividends. Any future determination to pay cash dividends will be at the discretion of our Board of Directors, subject to limitations under applicable law and contractual restrictions, and will depend upon our results of operations, financial condition and other factors deemed relevant by our Board of Directors.
We may issue additional shares of our common stock or Class A common stock that could dilute the value and market price of our stock.
We may decide or be required to issue, including upon the exercise of any outstanding stock options, or in connection with any acquisition made by us, additional shares of our common stock or Class A common stock that could dilute the value of our common stock or Class A common stock and may adversely affect the market price of our common stock or Class A common stock.
Our founder, through his holdings of our Class B common stock, exercises effective control of the Company, which may discourage potential acquisitions of our business and could have an adverse effect on the market price of our stock.
Holders of our Class B common stock are entitled to the lesser of ten votes per share or 49% of the total votes cast, and each share of Class B common stock is convertible at any time into one share of our common stock. Holders of our common stock are entitled to one vote for each share owned. Holders of our Class A common stock have no voting rights, except as required by Delaware law.
As of September 24, 2022, William E. Brown, our founder, beneficially controlled approximately 55% of the voting power of our capital stock. Accordingly, except to the extent that a class vote of the common stock is required by applicable law or our charter, he can effectively control all matters requiring stockholder approval, including the election of our directors, and can exert substantial control over our management and policies. The disproportionate voting rights of our Class B common stock and Mr. Brown’s substantial holdings of Class B common stock could have an adverse effect on the market price of our common stock and Class A common stock. Also, such disproportionate voting rights and Mr. Brown’s controlling interest may make us a less attractive target for a takeover than we otherwise might be, or render more difficult or discourage a merger proposal, tender offer or proxy contest, even if such actions were favored by our other stockholders, which could thereby deprive holders of common stock or Class A common stock of an opportunity to sell their shares for a “take-over” premium.
We have authorized the issuance of shares of common stock, Class A common stock and preferred stock, which may discourage potential acquisitions of our business and could have an adverse effect on the market price of our common stock and our Class A common stock.
Pursuant to our Fourth Amended and Restated Certificate of Incorporation, the Board of Directors is authorized to issue up to 80,000,000 shares of our common stock, 100,000,000 shares of our nonvoting Class A common stock, 3,000,000 shares of our Class B common stock and up to 1,000,000 additional shares of preferred stock without seeking the approval or consent of our stockholders, unless required by the NASDAQ Global Market. Although the issuance of the additional shares of nonvoting Class A common stock would not dilute the voting rights of the existing stockholders, it would have a dilutive effect on the economic interest of currently outstanding shares of common stock and Class B common stock similar to the dilutive effect of subsequent issuances of ordinary common stock. The issuance of preferred stock could, depending on the rights and privileges designated by the board with respect to any particular series, have a dilutive effect on the voting interests of the common stock and Class B common stock and the economic interests of our common stock, Class A common stock and Class B common stock. In addition, the disproportionate voting rights of our Class B common stock, and the ability of the board to issue stock to persons friendly to current management, may make us a less attractive target for a takeover than we otherwise might
20
be or render more difficult or discourage a merger proposal, tender offer or proxy contest, even if such actions were favored by our common stockholders, which could thereby deprive holders of common stock of an opportunity to sell their shares for a “take-over” premium.
Item 1B. Unresolved Staff Comments
None.
Item 2. Properties
We currently operate 45 manufacturing facilities totaling approximately 6.7 million square feet and 66 sales and distribution facilities totaling approximately 6.0 million square feet. Most sales and distribution centers consist of office and warehouse space, and several large bays for loading and unloading. Each sales and distribution center provides warehouse, distribution, sales and support functions for its geographic area. Our executive offices are located in Walnut Creek, California.
In addition to the manufacturing and sales and distribution facilities, the Garden segment leases approximately 270 acres of land in Oregon, New Jersey and Virginia used in its grass seed and live plant operations and owns approximately 574 acres of land in Virginia, North Carolina, Maryland, Ohio, New Jersey and Kentucky used in its live plant operations. The Pet segment leases approximately 80 acres of land in Florida to support its live fish operations.
We continually review the number, location and size of our manufacturing and sales and logistics facilities and expect to make changes over time to optimize our manufacturing and distribution footprints. We lease 21 of our manufacturing facilities and 52 of our sales and logistics facilities. These leases generally expire between fiscal years 2023 and 2034. Substantially all of the leases contain renewal provisions with automatic rent escalation clauses. The facilities we own are subject to major encumbrances under our principal credit facility. In addition to the facilities that are owned, our fixed assets are comprised primarily of machinery and equipment, trucks and warehousing, transportation and computer equipment.
21
Item 3. Legal Proceedings
In 2012, Nite Glow Industries, Inc. and its owner, Marni Markel, ("Nite Glow") filed suit in the U.S. District Court for New Jersey against the Company alleging that the applicator developed and used by the Company for certain of its branded topical flea and tick products infringes a patent held by Nite Glow and asserted related claims for breach of contract and misappropriation of confidential information based on the terms of a Non-Disclosure Agreement. On June 27, 2018, a jury returned a verdict in favor of Nite Glow on each of the three claims and awarded damages of approximately $12.6 million. The court ruled on post-trial motions in early June 2020, reducing the judgment amount to $12.4 million and denying the plaintiff's request for attorneys' fees. The Company filed its notice of appeal and the plaintiffs cross-appealed. On July 14, 2021, the Federal Circuit Court of Appeals issued its decision on the appeal. The Federal Circuit concluded that the Company did not infringe plaintiff's patent and determined that the breach of contract claim raised no non-duplicative damages and should be dismissed. The court affirmed the jury's liability verdict on the misappropriation of confidential information claim but ordered a new trial on damages on that single claim limited to the "head start" benefit, if any, generated by the confidential information. The Company intends to vigorously pursue its defenses in the future proceedings and believes that it will prevail on the merits as to the head start damages issue. While the Company believes that the ultimate resolution of this matter will not have a material impact on the Company's consolidated financial statements, the outcome of litigation is inherently uncertain and the final resolution of this matter may result in expense to the Company in excess of management's expectations.
From time to time, we are involved in certain legal proceedings in the ordinary course of business. Except as discussed above, we are not currently a party to any other legal proceedings that management believes could have a material effect on our financial position or results of operations.
Item 4. Mine Safety Disclosures
Not applicable.
22
PART II
Item 5. Market for the Registrant’s Common Equity, Related Stockholder Matters and Issuer Purchases of Equity Securities
Our common stock is traded on the NASDAQ Stock Market under the symbol CENT, and our class A common stock is traded on the NASDAQ Stock Market under the symbol CENTA. Our Class B stock is not listed on any market and generally cannot be transferred unless converted to common stock on a one-for-one basis.
As of November 11, 2022, there were approximately 72 holders of record of our common stock, approximately 385 holders of record of our Class A nonvoting common stock and 3 holders of record of our Class B stock.
Stock Performance Graph
The following graph compares the percentage change of our cumulative total stockholder return on our Common Stock (“CENT”) for the period from September 30, 2017 to September 24, 2022 with the cumulative total return of the NASDAQ Composite (U.S.) Index and the Dow Jones Non-Durable Household Products Index, a peer group index consisting of approximately 30 manufacturers and distributors of household products.
The comparisons in the graph below are based on historical data and are not indicative of, or intended to forecast, the possible future performance of our Common Stock.
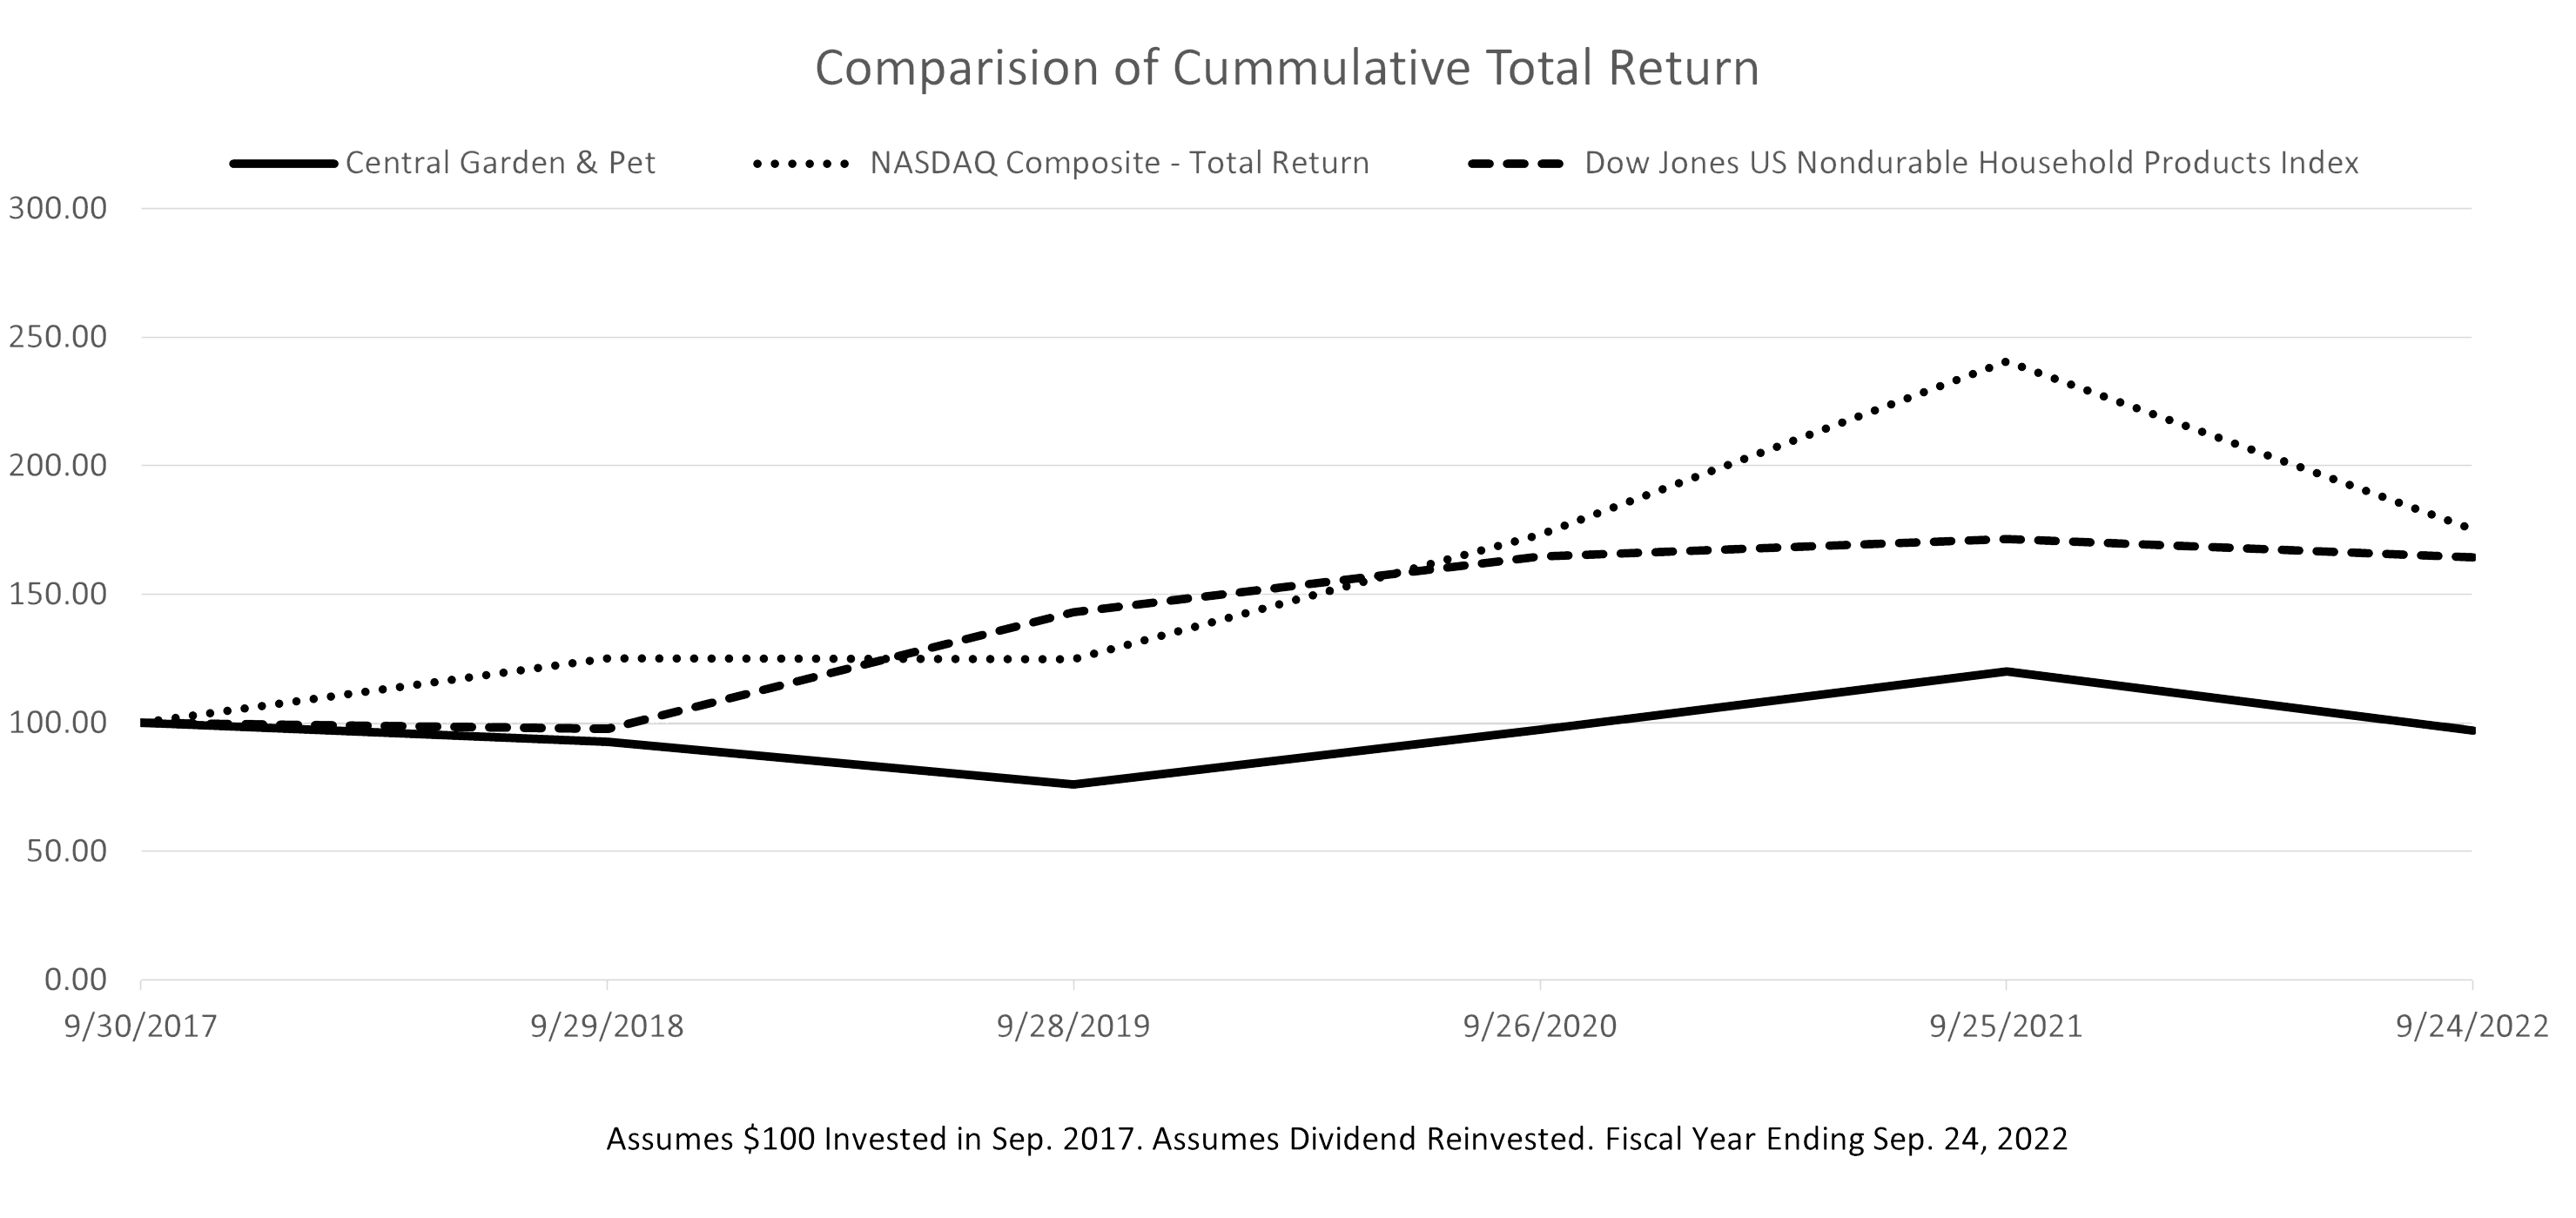
Total Return Analysis
| 9/30/2017 | 9/29/2018 | 9/28/2019 | 9/26/2020 | 9/25/2021 | 9/24/2022 | |||||||||||||||||||||||||||||||||
| Central Garden & Pet Company | $ | 100.00 | $ | 92.79 | $ | 76.18 | $ | 97.32 | $ | 120.16 | $ | 96.91 | ||||||||||||||||||||||||||
| NASDAQ Composite | $ | 100.00 | $ | 125.17 | $ | 124.88 | $ | 173.31 | $ | 240.72 | $ | 175.22 | ||||||||||||||||||||||||||
| Dow Jones US Nondurable Household Products | $ | 100.00 | $ | 97.66 | $ | 143.21 | $ | 164.90 | $ | 171.41 | $ | 164.41 | ||||||||||||||||||||||||||
23
Purchases of Equity Securities by the Issuer and Affiliated Purchasers
The following table sets forth the repurchases of any equity securities during the fourth quarter of the fiscal year ended September 24, 2022 and the dollar amount of authorized share repurchases remaining under our stock repurchase programs.
| Period | Total Number of Shares (or Units) Purchased |
Average Price Paid per Share (or Unit) |
Total Number of Shares (or Units) Purchased as Part of Publicly Announced Plans or Programs |
Maximum Number
(or Approximate
Dollar Value) of
Shares (or Units)
that May Yet Be
Purchased Under
the Plans or
Programs (1) (2)
|
||||||||||||||||||||||||||||
| June 26, 2022 – July 30, 2022 | 304,405 | (2) |
$ | 40.35 | 304,405 | $ | 100,000,000 | |||||||||||||||||||||||||
| July 31, 2022 – August 27, 2022 | 73,001 | (2) (3) |
41.05 | 69,350 | 100,000,000 | |||||||||||||||||||||||||||
| August 28, 2022 – September 24, 2022 | 121,614 | (2) | 36.42 | 121,614 | 100,000,000 | |||||||||||||||||||||||||||
| Total | 499,020 | $ | 39.50 | 495,369 | $ | 100,000,000 | (4) |
|||||||||||||||||||||||||
(1)In August 2019, our Board of Directors authorized a new share repurchase program to purchase up to $100 million of our common stock (the "2019 Repurchase Authorization”). The 2019 Repurchase Authorization has no fixed expiration date and expires when the amount authorized has been used or the Board withdraws its authorization. The repurchase of shares may be limited by certain financial covenants in our credit facility that restrict our ability to repurchase our stock. As of September 24, 2022, we had $100 million of authorization remaining under our 2019 Repurchase Authorization.
(2)In February 2019, our Board of Directors authorized us to make supplemental stock purchases to minimize dilution resulting from issuances under our equity compensation plans (the “Equity Dilution Authorization”). In addition to our regular share repurchase program, we are permitted to purchase annually a number of shares equal to the number of shares of restricted stock and stock options granted in the prior fiscal year, to the extent not already repurchased, and the current fiscal year. The Equity Dilution Authorization has no fixed expiration date and expires when the Board withdraws its authorization.
(3)Shares purchased during the period indicated represent withholding of a portion of shares to cover taxes in connection with the vesting of restricted stock and do not reduce the dollar value of shares that may be purchased under our stock repurchase plan.
(4)Excludes 0.1 million shares remaining under our Equity Dilution Authorization as of September 24, 2022.
24
Item 6. Selected Financial Data
The following selected statement of operations and balance sheet data as of and for the five fiscal years ended September 24, 2022 have been derived from our audited consolidated financial statements. The financial data set forth below should be read in conjunction with our consolidated financial statements and related notes thereto in “Item 8 – Financial Statements and Supplementary Data” and “Item 7 – Management’s Discussion and Analysis of Financial Condition and Results of Operations” included elsewhere herein.
| Fiscal Year Ended | ||||||||||||||||||||||||||||||||
| September 24, 2022 | September 25, 2021 | September 26, 2020 | September 28, 2019 | September 29, 2018 | ||||||||||||||||||||||||||||
| (in thousands, except per share amounts) | ||||||||||||||||||||||||||||||||
Statement of Operations Data (1):
|
||||||||||||||||||||||||||||||||
| Net sales | $ | 3,338,588 | $ | 3,303,684 | $ | 2,695,509 | $ | 2,383,010 | $ | 2,215,362 | ||||||||||||||||||||||
| Cost of goods sold | 2,346,283 | 2,332,783 | 1,898,951 | 1,678,969 | 1,539,986 | |||||||||||||||||||||||||||
| Gross profit | 992,305 | 970,901 | 796,558 | 704,041 | 675,376 | |||||||||||||||||||||||||||
Selling, general and administrative expenses (2)
|
732,269 | 716,405 | 598,581 | 551,973 | 508,040 | |||||||||||||||||||||||||||
| Operating income | 260,036 | 254,496 | 197,977 | 152,068 | 167,336 | |||||||||||||||||||||||||||
Interest expense, net (3)
|
(57,534) | (58,182) | (39,989) | (33,060) | (36,051) | |||||||||||||||||||||||||||
Other income (expense) (4)
|
(3,596) | (1,506) | (4,250) | 243 | (3,860) | |||||||||||||||||||||||||||
| Income before income taxes and noncontrolling interest | 198,906 | 194,808 | 153,738 | 119,251 | 127,425 | |||||||||||||||||||||||||||
Income tax expense (5)
|
46,234 | 42,035 | 32,218 | 26,604 | 3,305 | |||||||||||||||||||||||||||
| Income including noncontrolling interest | 152,672 | 152,773 | 121,520 | 92,647 | 124,120 | |||||||||||||||||||||||||||
| Net income (loss) attributable to noncontrolling interest | 520 | 1,027 | 844 | (139) | 526 | |||||||||||||||||||||||||||
| Net income attributable to Central Garden & Pet | $ | 152,152 | $ | 151,746 | $ | 120,676 | $ | 92,786 | $ | 123,594 | ||||||||||||||||||||||
| Net income per share attributable to Central Garden & Pet: | ||||||||||||||||||||||||||||||||
| Basic | $ | 2.86 | $ | 2.81 | $ | 2.23 | $ | 1.63 | $ | 2.39 | ||||||||||||||||||||||
| Diluted | $ | 2.80 | $ | 2.75 | $ | 2.20 | $ | 1.61 | $ | 2.32 | ||||||||||||||||||||||
| Weighted average shares used in the computation of income per share: | ||||||||||||||||||||||||||||||||
| Basic | 53,220 | 53,914 | 54,008 | 56,770 | 51,716 | |||||||||||||||||||||||||||
| Diluted | 54,425 | 55,248 | 54,738 | 57,611 | 53,341 | |||||||||||||||||||||||||||
| Other Data: | ||||||||||||||||||||||||||||||||
| Depreciation and amortization | $ | 80,948 | $ | 74,727 | $ | 55,359 | $ | 50,828 | $ | 47,199 | ||||||||||||||||||||||
| Capital expenditures | $ | 115,205 | $ | 80,333 | $ | 43,055 | $ | 31,577 | $ | 37,845 | ||||||||||||||||||||||
| Cash (used) provided by operating activities | $ | (34,030) | $ | 250,844 | $ | 264,273 | $ | 204,974 | $ | 114,112 | ||||||||||||||||||||||
| Cash used in investing activities | $ | (142,983) | $ | (899,359) | $ | (48,106) | $ | (76,263) | $ | (140,882) | ||||||||||||||||||||||
| Cash (used) provided by financing activities | $ | (66,815) | $ | 420,475 | $ | (60,560) | $ | (110,765) | $ | 474,783 | ||||||||||||||||||||||
25
| Fiscal Year Ended | ||||||||||||||||||||||||||||||||
| September 24, 2022 | September 25, 2021 | September 26, 2020 | September 28, 2019 | September 29, 2018 | ||||||||||||||||||||||||||||
| (in thousands) | ||||||||||||||||||||||||||||||||
| Balance Sheet Data: | ||||||||||||||||||||||||||||||||
| Cash and cash equivalents | $ | 177,442 | $ | 426,422 | $ | 652,712 | $ | 497,749 | $ | 482,106 | ||||||||||||||||||||||
| Working capital | $ | 1,087,962 | $ | 1,021,338 | $ | 1,085,021 | $ | 1,028,668 | $ | 1,004,334 | ||||||||||||||||||||||
Total assets (6)
|
$ | 3,282,002 | $ | 3,116,680 | $ | 2,339,364 | $ | 2,025,020 | $ | 1,907,209 | ||||||||||||||||||||||
Total debt (3)
|
$ | 1,186,562 | $ | 1,185,764 | $ | 694,053 | $ | 693,150 | $ | 692,153 | ||||||||||||||||||||||
Equity (7)
|
$ | 1,334,712 | $ | 1,223,541 | $ | 1,077,674 | $ | 996,177 | $ | 952,834 | ||||||||||||||||||||||
(1)Fiscal years 2018 through 2022 included 52 weeks.
(2)During fiscal 2019, we recognized a non-cash charge of $2.5 million related to the impairment of a certain long-lived intangible asset in our Pet Segment. This charge was included as part of selling, general and administrative expenses.
(3)During the first quarter of fiscal 2021, we issued $500 million aggregate principal amount of 4.125% senior notes due October 2030. We used a portion of the proceeds to redeem all of our outstanding 6.125% senior notes due 2023. As a result of our redemption of the 2023 Notes, we incurred incremental expenses of approximately $10.0 million, comprised of a call premium payment of $6.1 million, overlapping interest expense of approximately $1.4 million and a $2.5 million non-cash charge for the write-off of unamortized financing costs in interest expense. During the third quarter of fiscal 2021, we issued $400 million aggregate principal amount of 4.125% senior notes due April 2031.
In December 2017, we issued $300 million aggregate principal amount of 5.125% senior notes due February 2028.
(4)During fiscal 2020, we recognized a non-cash impairment charge of $3.6 million for two private company investments.
(5)Income tax expense was impacted by a fiscal 2018 tax benefit of $21.5 million from the revaluation of our deferred tax assets and liabilities as a result of the Tax Reform Act.
(6)In the first quarter of fiscal 2020, we adopted lease accounting standard ASC 842, which required us to recognize lease Right-of-Use Assets of $111 million on our balance sheet at adoption.
(7)During the fourth quarter of fiscal 2018, we issued 5,550,000 shares of Class A common stock at a public offering price of $37.00 per share and received net proceeds of approximately $196 million.
Item 7. Management’s Discussion and Analysis of Financial Condition and Results of Operations
The following is management’s discussion of the financial results, liquidity and other key items related to our performance. This discussion should be read in conjunction with our consolidated financial statements and the related notes and other financial information appearing elsewhere in this Form 10-K. This Form 10-K contains forward-looking statements that involve risks and uncertainties. Our actual results may differ materially from those indicated in forward-looking statements. See “Forward-Looking Statements” and “Item 1A – Risk Factors.”
Business Overview
Central Garden & Pet Company is a leading innovator, producer and distributor of branded and private label products for the lawn & garden and pet supplies markets in the United States.
In fiscal 2022, our consolidated net sales were $3.3 billion, of which our Pet segment, or Pet, accounted for approximately $1.9 billion and our Garden segment, or Garden, accounted for approximately $1.4 billion. In fiscal 2022, our operating income was $260 million
26
consisting of income from our Pet segment of $209 million, income from our Garden segment of $154 million and corporate expenses of $103 million .
Fiscal 2022 Financial Highlights
Financial summary:
•Net sales for fiscal 2022 increased $34.9 million, or 1.1%, to $3,339 million. Our Pet segment sales decreased 0.9%, and our Garden segment sales increased 3.7%.
•Organic net sales declined 3.3%, due primarily to a 6.8% decline in our Garden segment.
•Gross profit for fiscal 2022 increased $21.4 million, or 2.2%, to $992.3 million. Gross margin improved 30 basis points in fiscal 2022 to 29.7%, from 29.4% in fiscal 2021.
•Our operating income increased $5.5 million, or 2.2%, to $260.0 million in fiscal 2022, and as a percentage of net sales improved to 7.8% from 7.7% in fiscal 2021.
•Net income for fiscal 2022 was $152.2 million, or $2.80 per share on a diluted basis, compared to net income in fiscal 2021 of $151.7 million, or $2.75 per share on a diluted basis.
COVID-19 Impact
Central has been impacted by COVID-19 in a number of ways, including increased demand and sales in fiscal 2020 and 2021. The increased demand for our products challenged our supply chain and our ability to procure and manufacture enough product to meet the high levels of demand. Our supply chain experienced disruptions and delays which resulted in increased operational and logistics costs. At some of our facilities, we have experienced reduced productivity and increased employee absences. The pandemic and related increase in demand created operational challenges which impacted our service and fill rates.
Our manufacturing facilities and distribution centers are currently open and operational. To mitigate the impact of supply constraints of commodity, materials, freight and labor and extended inventory transit times and the resulting impact on our service and fill rates, we increased inventory levels in fiscal 2022 and our service and fill rates significantly improved in fiscal 2022. We continue to face high inflation in commodities, materials, labor and freight and the limited availability of labor. We have instituted significant pricing actions to mitigate the impact of the current inflationary environment although inflationary pressures continue to result in significant increases in costs for commodities, materials, labor and freight. Recently, inflation and global economic conditions have impacted consumer purchasing behavior resulting in higher inventory levels at our retail customers and at Central.
We may experience additional disruptions in our supply chain as the pandemic continues, although we cannot reasonably estimate the potential impact or timing of those events, and we may not be able to mitigate such impact. While vaccination efforts and the easing of government restrictions have signaled an improving public health environment, there remain concerns about COVID variants and the coming flu season, and the timing of a full recovery remains uncertain. The ultimate effect of the COVID-19 pandemic and the current high inflation environment on consumer behavior is unclear. Forecasting and planning remain challenging in the current environment and will continue to be challenging with public health concerns and inflationary cost pressures expected to continue into fiscal year 2023.
We believe we have sufficient liquidity to satisfy our cash needs with our cash and revolving credit facility as we manage through the current economic and health environment. In the current uncertain environment, our employees, customers and consumers will continue to be our priority as we manage our business to deliver long-term growth.
27
Results of Operations (GAAP)
The following table sets forth, for the periods indicated, the relative percentages that certain income and expense items bear to net sales:
| Fiscal Year Ended | ||||||||||||||||||||
| September 24, 2022 | September 25, 2021 | September 26, 2020 | ||||||||||||||||||
| Net sales | 100.0 | % | 100.0 | % | 100.0 | % | ||||||||||||||
| Cost of goods sold and occupancy | 70.3 | 70.6 | 70.4 | |||||||||||||||||
| Gross profit | 29.7 | 29.4 | 29.6 | |||||||||||||||||
| Selling, general and administrative | 21.9 | 21.7 | 22.2 | |||||||||||||||||
| Operating income | 7.8 | 7.7 | 7.4 | |||||||||||||||||
| Interest expense, net | (1.7) | (1.8) | (1.5) | |||||||||||||||||
| Other expense, net | (0.1) | — | (0.2) | |||||||||||||||||
| Income taxes | 1.4 | 1.3 | 1.2 | |||||||||||||||||
| Net income | 4.6 | % | 4.6 | % | 4.5 | % | ||||||||||||||
Fiscal 2022 Compared to Fiscal 2021
Net Sales
Net sales for fiscal 2022 increased $34.9 million, or 1.1%, to $3,338.6 million from $3,303.7 million in fiscal 2021, due primarily to the impact of recent acquisitions in our Garden segment. Organic net sales, which excludes the impact of acquisitions and divestitures in the last 12 months, decreased $108.1 million, or 3.3% in fiscal 2022. Generally, in both operating segments, volume declines were only partially offset by increased prices we implemented in response to high inflation. Our branded product sales, which include products we produce under Central brand names and products we produce under third-party brands, increased $53.8 million to $2.6 billion, and sales of other manufacturers’ products decreased $18.9 million to $730 million. Sales of branded products represented 78% of our net sales in fiscal 2022 compared with 77% in fiscal 2021. Sales of other manufacturers' products represented the balance of our net sales.
The following table indicates each class of similar products which represented approximately 10% or more of our consolidated net sales in the fiscal years presented:
| Category | 2022 | 2021 | 2020 | ||||||||||||||||||||
| (in millions) | |||||||||||||||||||||||
| Other garden products | $ | 865.3 | $ | 876.6 | $ | 491.7 | |||||||||||||||||
| Other pet products | 765.9 | 767.0 | 821.1 | ||||||||||||||||||||
| Other manufacturers' products | 730.2 | 749.1 | 600.7 | ||||||||||||||||||||
| Dog & cat products | 542.9 | 570.9 | 502.1 | ||||||||||||||||||||
| Wild bird | 434.3 | 340.1 | — | (1) | |||||||||||||||||||
| Controls & fertilizer products | — | (1) | — | (1) | 279.9 | ||||||||||||||||||
| Total | $ | 3,338.6 | $ | 3,303.7 | $ | 2,695.5 | |||||||||||||||||
| (1) The product category was less than 10% of our consolidated net sales in the period. | |||||||||||||||||||||||
Pet net sales decreased $16.8 million, or 0.9%, to $1,878.1 million in fiscal 2022 from $1,894.9 million in fiscal 2021. Net sales in the prior year included $3.9 million of sales from the Breeder’s Choice business we sold in December 2020. Organic net sales decreased $12.9 million, or 0.7%, as compared to the prior year. The decline in organic sales was due primarily to a volume-based sales decrease in our private label pet bed business attributable primarily to SKU rationalization and listing losses as we exited some profit-challenged product lines. Additionally, both aquatics and live fish had sales declines. The declines were partially offset by price driven increases in our dog and cat treats and toy business, outdoor cushion business and animal health business. Pet branded sales decreased $25.9 million, and sales of other manufacturers' products increased $9.1 million.
28
Garden net sales increased $51.7 million, or 3.7%, to $1,460.5 million in fiscal 2022 from $1,408.8 million in fiscal 2021. The sales increase was due to our fiscal 2021 acquisitions of DoMyOwn, Hopewell Nursery, Green Garden Products and D&D Commodities, which contributed $146.9 million of non-organic sales partially offset by an organic sales decrease of $95.2 million, or 6.8%. The organic sales decrease was due primarily to unfavorable weather and changing consumer and retailer buying patterns in response to high inflation and recessionary pressures. Most of our garden businesses had decreased sales, most notably in our chemical and controls business and in our sales of other manufacturers’ products, with the exception of wild bird feed which benefited from price increases taken to offset significant commodity inflation. Garden branded sales increased $79.7 million while sales of other manufacturers' products decreased $28.0 million.
Gross Profit
Gross profit in fiscal 2022 increased $21.4 million, or 2.2%, to $992.3 million from $970.9 million in fiscal 2021. Gross margin improved 30 basis points to 29.7% in fiscal 2022 from 29.4% in fiscal 2021. Garden drove the increase in gross profit and gross margin but both segments were impacted by the rapidly increasing cost environment. We have implemented significant price increases that positively impacted our fiscal 2022 results and intend to continue to seek further price increases to help offset the rising costs, but we do not anticipate we will be able to fully offset the expected cost pressures in fiscal 2023.
In the Pet segment, gross profit and margin were relatively flat due primarily to increased commodity, freight and labor costs and a volume decline in our pet bedding business, partially offset by price increases taken to combat inflation. In the Garden segment, the improved gross profit and margin were due primarily to price increases and the favorable impact of our fiscal 2021 acquisitions, which included the impact of purchase accounting in fiscal 2021, partially offset by increased commodity, freight and labor costs, most notably in our chemical and controls business, which was also impacted by volume declines.
Selling, General and Administrative
Selling, general and administrative expenses increased $15.9 million, or 2.2%, from $716.4 million in fiscal 2021 to $732.3 million in fiscal 2022. As a percentage of net sales, selling, general and administrative expenses increased from 21.7% in fiscal 2021 to 21.9% in fiscal 2022; both the Garden segment and corporate contributed to the increased percentage. Selling, general and administrative expense increased due primarily to the four fiscal 2021 acquisitions in our Garden segment including the amortization of the intangible assets resulting from purchase accounting, which did not have a full 12 months of expense in the prior year, and increased corporate expenses. Corporate expenses are included within administrative expense and relate to the costs of unallocated executive, administrative, finance, legal, human resource, and information technology functions.
Selling and delivery expense decreased $5.6 million, or 1.5%, to $358.1 million in fiscal 2022 and decreased as a percentage of net sales from 11.0% in fiscal 2021 to 10.7% in fiscal 2022. The decrease in selling and delivery expense was due primarily to a customer change from store delivery to warehouse pick-up, and a lower product volume delivered, partially offset by the increased expense related to the four fiscal 2021 acquisitions.
Warehouse and administrative expense increased $21.5 million, or 6.1%, to $374.2 million in fiscal 2022 and increased as a percentage of net sales to 11.2% in fiscal 2022 from 10.7% in fiscal 2021. The increased expense was driven by the addition of our four fiscal 2021 acquisitions in the Garden segment and increased rent expense at several facilities. Corporate expenses increased $10.3 million due primarily to growth in headcount, resulting in increased payroll costs, and increased third-party spend as we increased our investment in implementing our Central to Home strategy and to increased non-cash equity compensation. These increases were partially offset by lower variable compensation expense.
Operating Income
Operating income increased $5.5 million, or 2.2%, to $260.0 million in fiscal 2022 from $254.5 million in fiscal 2021. Our operating margin was 7.8% in fiscal 2022, increasing from 7.7% in fiscal 2021. Increased sales of $34.9 million and a 30 basis point increase in gross margin were partially offset by increased selling, general and administrative expense. Both operating income and margin were favorably impacted by significant pricing actions taken in response to the current high inflationary environment. The near-term economic environment remains volatile and likely to have an unfavorable impact on our results as we expect our margins and results to continue to be challenged in fiscal 2023.
Pet operating income increased $0.7 million, or 0.3%, to $208.9 million in fiscal 2022 from $208.2 million in fiscal 2021. Pet operating income increased due to lower selling, general and administrative expense partially offset by a decrease in net sales. Pet operating margin improved 10 basis points due to lower selling, general and administrative expense as a percentage of net sales.
Garden operating income increased $15.2 million, or 11.0%, to $154.0 million in fiscal 2022. The increase was due to increased sales and higher gross profit partially offset by higher selling, general and administrative expenses. Garden’s operating results were positively
29
impacted by a full year’s results from the acquisitions made in fiscal 2021, partially offset by poor weather conditions during the peak garden season. Garden operating margin improved 70 basis points to 10.5% due primarily to increased sales and an improved gross margin partially offset by higher selling, general and administrative expense as a percentage of net sales and the initial inventory-related impact of purchase accounting from our four recent acquisitions.
Corporate expenses increased $10.3 million due primarily to growth in headcount, resulting in increased payroll costs, and increased third-party spend as we increased our investment in implementing our Central to Home strategy and to increased non-cash equity compensation. These increases were partially offset by lower variable compensation expense.
Net Interest Expense
Net interest expense decreased $0.7 million, or 1.1%, from $58.2 million in fiscal 2021 to $57.5 million in fiscal 2022. In October 2020, we issued $500 million aggregate principal amount of 4.125% senior notes due October 2030 and used the proceeds to redeem all of our outstanding aggregate principal amount 6.125% senior notes due 2023 with the remainder for general corporate purposes. As a result of our redemption of the 2023 Notes, we recognized incremental interest expense of approximately $10.0 million in fiscal 2021. Partially offsetting the reduction from the prior year’s incremental interest expense was increased interest expense in the current year due primarily to higher average debt outstanding related to our issuance in April 2021 of $400 million aggregate principal amount of 4.125% senior notes due April 2031.
Debt outstanding on September 24, 2022 was $1,186.6 million compared to $1,185.8 million as of September 25, 2021. Our average borrowing rate for fiscal 2022 was 4.5% compared to 4.4% for fiscal 2021.
Other Expense
Other expense is comprised of income or loss from investments accounted for under the equity method of accounting and foreign currency exchange gains and losses. Other expense was $3.6 million for fiscal 2022 compared to $1.5 million for fiscal 2021, due primarily to foreign currency losses in fiscal 2022.
Income Tax
Our effective income tax rate was 23.2% for fiscal 2022 compared to 21.6% for fiscal 2021. The increase in our effective income tax rate was due primarily to a reduced tax benefit from stock compensation compared to the prior year.
Net Income and Earnings Per Share
Our net income for fiscal 2022 was $152.2 million, or $2.80 per diluted share, compared to $151.7 million, or $2.75 per diluted share, for fiscal 2021. An improvement in operating income in fiscal 2022 was partially offset by increased other expense and income taxes. Additionally, fiscal 2022 EPS was aided by a 1% decrease in diluted shares.
Fiscal 2021 Compared to Fiscal 2020
For a discussion of our results of operations in fiscal 2021 compared to fiscal 2020, please see Item 7 of our Annual Report on Form 10-K for the fiscal year ended September 25, 2021 filed with the SEC.
Use of Non-GAAP Financial Measures
We report our financial results in accordance with accounting principles generally accepted in the United States (GAAP). However, to supplement the financial results prepared in accordance with GAAP, we use non-GAAP financial measures including adjusted EBITDA, organic sales, and non-GAAP net income and diluted net income per share. Management believes these non-GAAP financial measures that exclude the impact of specific items (described below) may be useful to investors in their assessment of our ongoing operating performance and provide additional meaningful comparisons between current results and results in prior operating periods.
Adjusted EBITDA is defined by us as income before income tax, net other expense, net interest expense and depreciation and amortization and stock-based compensation expense (or operating income plus depreciation and amortization expense and stock-based compensation expense). We present adjusted EBITDA because we believe that adjusted EBITDA is a useful supplemental measure in evaluating the cash flows and performance of our business and provides greater transparency into our results of operations. Adjusted EBITDA is used by our management to perform such evaluation. Adjusted EBITDA should not be considered in isolation or as a substitute for cash flow from operations, income from operations or other income statement measures prepared in accordance with GAAP. We believe that adjusted EBITDA is frequently used by investors, securities analysts and other interested parties in their evaluation of companies, many of which present adjusted EBITDA when reporting their results. Other companies may calculate adjusted EBITDA differently and it may not be comparable.
30
We have also provided organic net sales, a non-GAAP measure that excludes the impact of businesses purchased or exited in the prior 12 months, because we believe it permits investors to better understand the performance of our historical business without the impact of recent acquisitions or dispositions.
The reconciliations of these non-GAAP measures to the most directly comparable financial measures calculated and presented in accordance with GAAP are shown in the tables below. We believe that the non-GAAP financial measures provide useful information to investors and other users of our financial statements, by allowing for greater transparency in the review of our financial and operating performance. Management also uses these non-GAAP financial measures in making financial, operating and planning decisions and in evaluating our performance, and we believe these measures similarly may be useful to investors in evaluating our financial and operating performance and the trends in our business from management's point of view. While our management believes that non-GAAP measurements are useful supplemental information, such adjusted results are not intended to replace our GAAP financial results and should be read in conjunction with those GAAP results.
Non-GAAP financial measures reflect adjustments based on the following items:
•Incremental expenses from note redemption and issuance: we have excluded the impact of the incremental expenses incurred from the note redemption and issuance as they represent an infrequent transaction that occurs in limited circumstances that impacts the comparability between operating periods. We believe the adjustment of these expenses supplements the GAAP information with a measure that may be used to assess the sustainability of our operating performance.
•Loss on sale of business: we have excluded the impact of the loss on the sale of a business as it represents an infrequent transaction that occurs in limited circumstances that impacts the comparability between operating periods. We believe the adjustment of this loss supplements the GAAP information with a measure that may be used to assess the sustainability of our operating performance.
From time to time in the future, there may be other items that we may exclude if we believe that doing so is consistent with the goal of providing useful information to investors and management.
The non-GAAP adjustments made reflect the following:
(1)During the first quarter of fiscal 2021, we issued $500 aggregate principal amount of 4.125% senior notes due October 2030. We used a portion of the proceeds to redeem all of our outstanding 6.125% senior notes due 2023. As a result of our redemption of the 2023 Notes, we incurred incremental expenses of approximately $10.0 million, comprised of a call premium payment of $6.1 million, overlapping interest expense of approximately $1.4 million and a $2.5 million non-cash charge for the write-off of unamortized financing costs in interest expense. These amounts are included in interest expense in the consolidated statements of operations.
(2)During the first quarter of fiscal 2021, we recognized a loss of $2.6 million, included in selling, general and administrative expense in the consolidated statement of operations, from the sale of our Breeder's Choice business unit after concluding it was not a strategic business for our Pet segment.
| GAAP to Non-GAAP Reconciliation For the Fiscal Year Ended |
||||||||||||||
| September 24, 2022 | September 25, 2021 | |||||||||||||
| (in thousands, except per share amounts) | ||||||||||||||
| Net Income and Diluted Net Income Per Share Reconciliation | ||||||||||||||
| GAAP net income attributable to Central Garden & Pet Company | $ | 152,152 | $ | 151,746 | ||||||||||
| Incremental expenses from note redemption and issuance | (1) |
9,952 | ||||||||||||
| Loss on sale of business | (2) |
2,611 | ||||||||||||
| Tax effect of incremental redemption expenses and loss on sale | (2,711) | |||||||||||||
| Non-GAAP net income attributable to Central Garden & Pet Company | $ | 152,152 | $ | 161,598 | ||||||||||
| GAAP diluted net income per share | $ | 2.80 | $ | 2.75 | ||||||||||
| Non-GAAP diluted net income per share | $ | 2.80 | $ | 2.92 | ||||||||||
| Shares used in GAAP and non-GAAP diluted net income per share calculation | 54,425 | 55,248 | ||||||||||||
31
Organic Net Sales Reconciliation
We have provided organic net sales, a non-GAAP measure that excludes the impact of recent acquisitions and dispositions, because we believe it permits investors to better understand the performance of our historical business. We define organic net sales as net sales from our historical business derived by excluding the net sales from businesses acquired or exited in the preceding 12 months. After an acquired business has been part of our consolidated results for 12 months, the change in net sales thereafter is considered part of the increase or decrease in organic net sales.
| CONSOLIDATED | GAAP to Non-GAAP Reconciliation For the Fiscal Year Ended September 24, 2022 |
|||||||||||||||||||
| Net sales (GAAP) | Effect of acquisitions & divestitures on net sales | Net sales organic | ||||||||||||||||||
| (in millions) | ||||||||||||||||||||
| Reported net sales FY 2022 | $ | 3,338.6 | $ | 146.9 | $ | 3,191.7 | ||||||||||||||
| Reported net sales FY 2021 | 3,303.7 | 3.9 | 3,299.8 | |||||||||||||||||
| $ increase (decrease) | $ | 34.9 | $ | 143.0 | $ | (108.1) | ||||||||||||||
| % increase (decrease) | 1.1 | % | (3.3) | % | ||||||||||||||||
| PET | GAAP to Non-GAAP Reconciliation For the Fiscal Year Ended September 24, 2022 |
|||||||||||||||||||
| Net sales (GAAP) | Effect of acquisitions & divestitures on net sales | Net sales organic | ||||||||||||||||||
| (in millions) | ||||||||||||||||||||
| Reported net sales FY 2022 | $ | 1,878.1 | $ | — | $ | 1,878.1 | ||||||||||||||
| Reported net sales FY 2021 | 1,894.9 | 3.9 | 1,891.0 | |||||||||||||||||
| $ decrease | $ | (16.8) | $ | (3.9) | $ | (12.9) | ||||||||||||||
| % decrease | (0.9) | % | (0.7) | % | ||||||||||||||||
| GARDEN | GAAP to Non-GAAP Reconciliation For the Fiscal Year Ended September 24, 2022 |
|||||||||||||||||||
| Net sales (GAAP) | Effect of acquisitions & divestitures on net sales | Net sales organic | ||||||||||||||||||
| (in millions) | ||||||||||||||||||||
| Reported net sales FY 2022 | $ | 1,460.5 | $ | 146.9 | $ | 1,313.6 | ||||||||||||||
| Reported net sales FY 2021 | 1,408.8 | — | 1,408.8 | |||||||||||||||||
| $ increase (decrease) | $ | 51.7 | $ | 146.9 | $ | (95.2) | ||||||||||||||
| % increase (decrease) | 3.7 | % | (6.8) | % | ||||||||||||||||
32
| GAAP to non-GAAP Reconciliation Fiscal Year Ended September 24, 2022 |
||||||||||||||||||||||||||
| (in thousands) | ||||||||||||||||||||||||||
| Adjusted EBITDA Reconciliation | Garden | Pet | Corp | Total | ||||||||||||||||||||||
| Net income attributable to Central Garden & Pet | — | — | — | $ | 152,152 | |||||||||||||||||||||
| Interest expense, net | — | — | — | 57,534 | ||||||||||||||||||||||
| Other expense | — | — | — | 3,596 | ||||||||||||||||||||||
| Income tax expense | — | — | — | 46,234 | ||||||||||||||||||||||
| Net income attributable to noncontrolling interest | — | — | — | 520 | ||||||||||||||||||||||
| Sum of items below operating income | — | — | — | 107,884 | ||||||||||||||||||||||
| Income (loss) from operations | 153,956 | 208,924 | (102,844) | 260,036 | ||||||||||||||||||||||
| Depreciation & amortization | 36,583 | 38,960 | 5,405 | 80,948 | ||||||||||||||||||||||
| Noncash stock-based compensation | $ | 25,817 | $ | 25,817 | ||||||||||||||||||||||
| Adjusted EBITDA | $ | 190,539 | $ | 247,884 | $ | (71,622) | $ | 366,801 | ||||||||||||||||||
| GAAP to non-GAAP Reconciliation Fiscal Year Ended September 25, 2021 |
||||||||||||||||||||||||||
| (in thousands) | ||||||||||||||||||||||||||
| Adjusted EBITDA Reconciliation | Garden | Pet | Corp | Total | ||||||||||||||||||||||
| Net income attributable to Central Garden & Pet | — | — | — | $ | 151,746 | |||||||||||||||||||||
| Interest expense, net | — | — | — | 58,182 | ||||||||||||||||||||||
| Other expense | — | — | — | 1,506 | ||||||||||||||||||||||
| Income tax expense | — | — | — | 42,035 | ||||||||||||||||||||||
| Net income attributable to noncontrolling interest | — | — | — | 1,027 | ||||||||||||||||||||||
| Sum of items below operating income | — | — | — | 102,750 | ||||||||||||||||||||||
| Income (loss) from operations | 138,755 | 208,201 | (92,460) | 254,496 | ||||||||||||||||||||||
| Depreciation & amortization | 33,050 | 36,952 | 4,725 | 74,727 | ||||||||||||||||||||||
| Noncash stock-based compensation | $ | 23,127 | $ | 23,127 | ||||||||||||||||||||||
| Adjusted EBITDA | $ | 171,805 | $ | 245,153 | $ | (64,608) | $ | 352,350 | ||||||||||||||||||
Inflation
Our revenues and margins are dependent on various economic factors, including rates of inflation, energy costs, consumer attitudes toward discretionary spending, currency fluctuations, and other macro-economic factors which may impact levels of consumer spending. In fiscal years 2020 through 2022, we have been adversely impacted by rising input costs related to inflation, particularly relating to grain and seed prices, fuel prices and the ingredients used in our garden controls and fertilizer business as well as heightened import costs such as shipping container costs and tariffs. Although our gross and operating margins increased in fiscal 2022, rising costs are making it difficult for us to further increase prices to our customers at a pace sufficient for us to maintain our margins.
In fiscal 2022, we continued to experience increasing inflationary pressure, including notable increases in costs for key commodities, materials, labor and freight. During fiscal 2021, inflation was broad-based and we saw significant increases across commodity and material costs, freight and labor. During fiscal 2020, we saw more moderate increases to commodity, labor and freight costs.
Weather and Seasonality
Our sales of lawn and garden products are influenced by weather and climate conditions in the different markets we serve. Our Garden segment’s business is highly seasonal. In fiscal 2022, approximately 66% of our Garden segment’s net sales and 59% of our total net sales occurred during our second and third fiscal quarters. Substantially all of the Garden segment’s operating income is typically generated in this period.
33
Liquidity and Capital Resources
We have financed our growth through a combination of internally generated funds, bank borrowings, supplier credit, and sales of equity and debt securities to the public.
Our business is seasonal and our working capital requirements and capital resources track closely to this seasonal pattern. Generally, during the first fiscal quarter, accounts receivable reach their lowest level while inventory, accounts payable and short-term borrowings begin to increase. During the second fiscal quarter, receivables, accounts payable and short-term borrowings increase, reflecting the build-up of inventory and related payables in anticipation of the peak lawn and garden selling season. During the third fiscal quarter, inventory levels remain relatively constant while accounts receivable peak and short-term borrowings start to decline as cash collections are received during the peak selling season. During the fourth fiscal quarter, inventory levels are at their lowest, and accounts receivable and payables are substantially reduced through conversion of receivables to cash.
We service two broad markets: pet supplies and lawn and garden supplies. Our pet supplies businesses involve products that have a year-round selling cycle with a slight degree of seasonality. As a result, it is not necessary to maintain large quantities of inventory to meet peak demands. Our lawn and garden businesses are highly seasonal with approximately 66% of our Garden segment’s net sales occurring during the second and third fiscal quarters. This seasonality requires the shipment of large quantities of product well ahead of the peak consumer buying periods. To encourage retailers and distributors to stock large quantities of inventory, industry practice has been for manufacturers to give extended credit terms and/or promotional discounts.
Operating Activities
Net cash used in operating activities increased $284.8 million, from $250.8 million of cash provided by operating activities in fiscal 2021 to $34.0 million of cash used in operating activities in fiscal 2022. The increase in cash used was due primarily to changes in our working capital accounts, primarily an increase in inventory, driven in part by higher costs of inventory in this inflationary environment as well as management's decision to increase inventory levels to help improve fill rates and customer service adversely impacted by a challenged supply chain.
Net cash provided by operating activities decreased $13.5 million, from $264.3 million in fiscal 2020 to $250.8 million in fiscal 2021. The decrease in cash provided was due primarily to changes in our working capital accounts, primarily an increase in inventory from an intentional build-up due to the overall increased demand for our products, as compared to fiscal 2020.
Investing Activities
Net cash used in investing activities decreased $756.4 million from $899.4 million in fiscal 2021 to $143.0 million in fiscal 2022. The decrease in cash used in investing activities was due primarily to acquisition activity in the prior year. The decrease was partially offset by an increase in capital expenditures of approximately $35 million in the current year compared to the prior year and increased investments in the current year compared to the prior year. During fiscal 2021, we acquired DoMyOwn for approximately $81 million, Hopewell Nursery for approximately $81 million, Green Garden Products for approximately $571 million and D&D Commodities for approximately $88 million.
Net cash used in investing activities increased $851.3 million from $48.1 million in fiscal 2020 to $899.4 million in fiscal 2021. The increase in cash used in investing activities was due primarily to acquisition activity and an increase in capital expenditures of approximately $37 million in fiscal 2021 compared to fiscal 2020, partially offset by proceeds received from the sale of our Breeder's Choice business during the first quarter of fiscal 2021 and decreased investments in fiscal 2021 compared to fiscal 2020. During the first quarter of fiscal 2021, we acquired DoMyOwn for approximately $81 million. During the second quarter of fiscal 2021, we acquired Hopewell Nursery for approximately $81 million and Green Garden Products for approximately $571 million and in the fourth quarter of fiscal 2021, we acquired D&D Commodities for approximately $88 million.
Financing Activities
Net cash used by financing activities increased $487.3 million from $420.5 million of cash provided in fiscal 2021 to $66.8 million of cash used in fiscal 2022. The increase in cash used by financing activities during the current year was due primarily to our prior year issuance of $500 million of our 2030 Notes in October 2020 and $400 million of our 2031 Notes in April 2021, partially offset by the prior year repayment of our 2023 Notes and the corresponding premium paid on extinguishment as well as debt issuance costs incurred on the issuances of the 2030 Notes and 2031 Notes. We also increased open market purchases of our common stock during the current year period as compared to the prior year. During fiscal 2022, we repurchased approximately 1.4 million shares of our non-voting common stock (CENTA) on the open market at an aggregate cost of approximately $56.2 million, or $40.79 per share, and approximately 39,000 shares of our voting common stock (CENT) on the open market at an aggregate cost of approximately $1.6 million, or $39.72 per share, in addition to $5.4 million used for minimum statutory tax withholdings related to the net share settlement of our stock.
Net cash provided by financing activities increased $481.0 million from $60.6 million of cash used in fiscal 2020 to $420.5 million cash provided in fiscal 2021. The increase in cash provided by financing activities during fiscal 2021 was due primarily to the issuance of $500 million of our 2030 Notes in October 2020 and $400 million of our 2031 Notes in April 2021, partially offset by the repayment of our 2023
34
Notes and the corresponding premium paid on extinguishment as well as debt issuance costs incurred on the issuances of the 2030 Notes and 2031 Notes. We also decreased open market purchases of our common stock during fiscal 2021 as compared to fiscal 2020. During fiscal 2021, the Company repurchased approximately 0.5 million shares of its non-voting common stock (CENTA) on the open market at an aggregate cost of approximately $21.8 million, or $41.91 per share, in addition to $8.2 million used for minimum statutory tax withholdings related to the net share settlement of our stock.
We expect that our principal sources of funds will be cash generated from our operations, proceeds from our debt and equity offerings, and, if necessary, borrowings under our $750 million asset backed loan facility. Based on our anticipated cash needs, availability under our asset backed loan facility and the scheduled maturity of our debt, we believe that our sources of liquidity should be adequate to meet our working capital, capital spending and other cash needs for at least the next 12 months. However, we cannot assure you that these sources will continue to provide us with sufficient liquidity and, should we require it, that we will be able to obtain financing on terms satisfactory to us, or at all.
We anticipate that our capital expenditures, which are related primarily to replacements and expansion of and upgrades to plant and equipment and also investment in our continued implementation of a scalable enterprise-wide information technology platform, will be approximately $70 million - $80 million over the next 12 months.
As part of our growth strategy, we have acquired a large number of businesses in the past, and we anticipate that we will continue to evaluate potential acquisition candidates in the future. If one or more potential acquisition opportunities, including those that would be material, become available in the near future, we may require additional external capital. In addition, such acquisitions would subject us to the general risks associated with acquiring companies, particularly if the acquisitions are relatively large.
Stock Repurchases
During fiscal 2022, we repurchased approximately 1.4 million shares of our non-voting common stock (CENTA) on the open market at an aggregate cost of approximately $56.2 million, or $40.79 per share, and approximately 39,000 shares of our voting common stock (CENT) on the open market at an aggregate cost of approximately $1.6 million, or $39.72 per share. In August 2019, our Board of Directors authorized a new share repurchase program to purchase up to $100 million of our common stock (the "2019 Repurchase Authorization"). The 2019 Repurchase Authorization has no fixed expiration date and expires when the amount authorized has been used or the Board withdraws its authorization. As of September 24, 2022, no repurchases had been made under the $100 million 2019 Repurchase Authorization.
In February 2019, the Board of Directors authorized us to make supplemental purchases to minimize dilution resulting from issuances under our equity compensation plans (the "Equity Dilution Authorization"). In addition to our regular share repurchase program, we are permitted to purchase annually a number of shares equal to the number of shares of restricted stock or stock options granted in the prior fiscal year, to the extent not already repurchased, and the current fiscal year. The Equity Dilution Authorization has no fixed expiration date and expires when the Board withdraws its authorization. As of September 25, 2022, we had authorization remaining to repurchase up to 0.1 million shares under our Equity Dilution Authorization.
Total Debt
At September 24, 2022, our total debt outstanding was $1,186.6 million versus $1,185.8 million at September 25, 2021.
Senior Notes
Issuance of $400 million 4.125% Senior Notes due 2031
In April 2021, we issued $400 million aggregate principal amount of 4.125% senior notes due April 2031 (the "2031 Notes"). We used the net proceeds from the offering to repay all outstanding borrowings under our Amended Credit Facility, with the remainder used for general corporate purposes.
We incurred approximately $6 million of debt issuance costs in conjunction with this issuance, which included underwriter fees and legal, accounting and rating agency expenses. The debt issuance costs are being amortized over the term of the 2031 Notes.
The 2031 Notes require semi-annual interest payments on April 30 and October 30. The 2031 Notes are unconditionally guaranteed on a senior basis by each of our existing and future domestic restricted subsidiaries which are borrowers under or guarantors of our Amended Credit Facility. The 2031 Notes were issued in a private placement under Rule 144A and will not be registered under the Securities Act of 1933.
We may redeem some or all of the 2031 Notes at anytime, at our option, prior to April 30, 2026, at the principal amount plus a "make whole" premium. At any time prior to April 30, 2024, we may also redeem, at our option, up to 40% of the notes with the proceeds of certain equity offerings at a redemption price of 104.125% of the principal amount of the notes. We may redeem some or all of the 2031 Notes at
35
our option, at any time on or after April 30, 2026 for 102.063%, on or after April 30, 2027 for 101.375%, on or after April 30, 2028 for 100.688% and on or after April 30, 2029 for 100.0%, plus accrued and unpaid interest.
The holders of the 2031 Notes have the right to require us to repurchase all or a portion of the 2031 Notes at a purchase price equal to 101% of the principal amount of the notes repurchased, plus accrued and unpaid interest, upon the occurrence of specific kinds of changes of control.
The 2031 Notes contain customary high yield covenants, including covenants limiting debt incurrence and restricted payments, subject to certain baskets and exceptions. We were in compliance with all financial covenants as of September 24, 2022.
Issuance of $500 million 4.125% Senior Notes due 2030 and Redemption of $400 million 6.125% Senior Notes due 2023
In October 2020, we issued $500 million aggregate principal amount of 4.125% senior notes due October 2030 (the "2030 Notes"). In November 2020, we used a portion of the net proceeds to redeem all of our outstanding 6.125% senior notes due November 2023 (the "2023 Notes") at a redemption price of 101.531% plus accrued and unpaid interest, and to pay related fees and expenses, with the remainder used for general corporate purposes.
We incurred approximately $8.0 million of debt issuance costs associated with this transaction, which included underwriter fees and legal, accounting and rating agency expenses. The debt issuance costs are being amortized over the term of the 2030 Notes.
As a result of our redemption of the 2023 Notes, we incurred a call premium payment of $6.1 million, overlapping interest expense for 30 days of approximately $1.4 million and a $2.5 million non-cash charge for the write-off of unamortized deferred financing costs related to the 2023 Notes. These amounts are included in interest expense in the consolidated statements of operations.
The 2030 Notes require semiannual interest payments on October 15 and April 15, which commenced April 15, 2021. The 2030 Notes are unconditionally guaranteed on a senior basis by each of our existing and future domestic restricted subsidiaries which are borrowers under or guarantors of our senior secured revolving credit facility or guarantee our other debt.
We may redeem some or all of the 2030 Notes at anytime, at our option, prior to October 15, 2025, at a price equal to 100% of the principal amount plus a “make-whole” premium. Prior to October 15, 2023, we may redeem up to 40% of the original aggregate principal amount of the notes with the proceeds of certain equity offerings at a redemption price of 104.125% of the principal amount of the notes. We may redeem some or all of the 2030 Notes, at our option, in whole or in part, at any time on or after October 15, 2025 for 102.063%, on or after October 15, 2026 for 101.375%, on or after October 15, 2027 for 100.688% and on or after October 15, 2028 for 100.0%, plus accrued and unpaid interest.
The holders of the 2030 Notes have the right to require us to repurchase all or a portion of the 2030 Notes at a purchase price equal to 101.0% of the principal amount of the notes repurchased, plus accrued and unpaid interest upon the occurrence of a change of control.
The 2030 Notes contain customary high yield covenants, including covenants limiting debt incurrence and restricted payments, subject to certain baskets and exceptions. We were in compliance with all financial covenants as of September 24, 2022.
$300 Million, 5.125% Senior Notes due 2028
On December 14, 2017, we issued $300 million aggregate principal amount of 5.125% senior notes due February 2028 (the "2028 Notes"). We used the net proceeds from the offering to finance acquisitions and for general corporate purposes.
We incurred approximately $4.6 million of debt issuance costs in conjunction with this transaction, which included underwriter fees and legal, accounting and rating agency expenses. The debt issuance costs are being amortized over the term of the 2028 notes.
The 2028 Notes require semiannual interest payments on February 1 and August 1. The 2028 Notes are unconditionally guaranteed on a senior basis by our existing and future domestic restricted subsidiaries who are borrowers under or guarantors of our senior secured revolving credit facility or who guarantee the 2023 Notes.
We may redeem some or all of the 2028 Notes at anytime, at our option, prior to January 1, 2023 at the principal amount plus a "make whole" premium. We may redeem some or all of the 2028 Notes at our option, at any time on or after January 1, 2023 for 102.563% on or after January 1, 2024 for 101.708%, on or after January 1, 2025 for 100.854% and on or after January 1, 2026 for 100% plus accrued and unpaid interest.
The holders of the 2028 Notes have the right to require us to repurchase all or a portion of the 2028 Notes at a purchase price equal to 101% of the principal amount of the notes repurchased, plus accrued and unpaid interest upon the occurrence of a change of control.
The 2028 Notes contain customary high-yield covenants, including covenants limiting debt incurrence and restricted payments, subject to certain baskets and exceptions. We were in compliance with all covenants as of September 24, 2022.
36
Asset-Based Loan Facility Amendment
On December 16, 2021, we entered into a Third Amended and Restated Credit Agreement (“Amended Credit Agreement”). The Amended Credit Agreement amended and restated the previous credit agreement dated September 27, 2019 (the "Predecessor Credit Agreement"), and provides for a $750 million principal amount senior secured asset-based revolving credit facility, with up to an additional $400 million principal amount available with the consent of the Lenders, as defined, if we exercise the uncommitted accordion feature set forth therein (collectively, the “Amended Credit Facility”). The Amended Credit Facility matures on December 16, 2026. We may borrow, repay and reborrow amounts under the Amended Credit Facility until its maturity date, at which time all amounts outstanding under the Amended Credit Facility must be repaid in full.
The Amended Credit Facility is subject to a borrowing base that is calculated using a formula based upon eligible receivables and inventory, and at our election, eligible real property, minus certain reserves. We did not draw down any commitments under the Amended Credit Facility upon closing. Proceeds of the Amended Credit Facility will be used for general corporate purposes. Net availability under the Amended Credit Facility was approximately $517 million as of September 24, 2022. The Amended Credit Facility includes a $50 million sublimit for the issuance of standby letters of credit and a $75 million sublimit for short-notice borrowings. As of September 24, 2022, there were no borrowings outstanding and no letters of credit outstanding under the Amended Credit Facility. Outside of the Amended Credit Facility, there were other letters of credit of $1.3 million outstanding as of September 24, 2022.
Borrowings under the Amended Credit Facility will bear interest at an index based on LIBOR (which will not be less than 0.00%) or, at our option, the Base Rate, plus, in either case, an applicable margin based on our usage under the credit facility. Base Rate is defined as the highest of (a) the Truist prime rate, (b) the Federal Funds Rate plus 0.50%, (c) one-month LIBOR plus 1.00% and (d) 0.00%. The applicable margin for LIBOR-based borrowings fluctuates between 1.00%-1.50%, and was 1.0% as of September 24, 2022, and the applicable margin for Base Rate borrowings fluctuates between 0.00%-0.50%, and was 0.00% as of September 24, 2022. An unused line fee shall be payable quarterly in respect of the total amount of the unutilized Lenders’ commitments and short-notice borrowings under the Amended Credit Facility. Letter of credit fees at the applicable margin on the average undrawn and unreimbursed amount of letters of credit shall be payable quarterly and a facing fee of 0.125% shall be payable quarterly for the stated amount of each letter of credit. We are also required to pay certain fees to the administrative agent under the Amended Credit Facility. The Amended Credit Facility provides for the transition from LIBOR to Secured Overnight Financing Rate ("SOFR") and does not require an amendment in connection with such transition. As of September 24, 2022, the applicable interest rate related to Base Rate borrowings was 6.3%, and the applicable interest rate related to one-month LIBOR-based borrowings was 4.1%.
We incurred approximately $2.4 million of debt issuance costs in conjunction with this transaction, which included lender fees and legal expenses. The debt issuance costs are being amortized over the term of the Amended Credit Facility.
The Amended Credit Facility continues to contain customary covenants, including financial covenants which require us to maintain a minimum fixed charge coverage ratio of 1:1 upon triggered quarterly testing (e.g. when availability falls below certain thresholds established in the agreement), reporting requirements and events of default. The Amended Credit Facility is secured by substantially all assets of the borrowing parties, including (i) pledges of 100% of the stock or other equity interest of each domestic subsidiary that is directly owned by such entity and (ii) 65% of the stock or other equity interest of each foreign subsidiary that is directly owned by such entity, in each case subject to customary exceptions. We were in compliance with all financial covenants under the Amended Credit Facility as of September 24, 2022.
Summarized Financial Information for Guarantors and the Issuer of Guaranteed Securities
Central (the "Parent/Issuer") issued $400 million of 2031 Notes in April 2021, $500 million of 2030 Notes in October 2020, and $300 million of 2028 Notes in December 2017. The 2031 Notes, 2030 Notes and 2028 Notes are fully and unconditionally guaranteed on a joint and several senior basis by each of our existing and future domestic restricted subsidiaries (the "Guarantors") which are guarantors of our senior secured revolving credit facility ("Credit Facility"). The 2031 Notes, 2030 Notes and 2028 Notes are unsecured senior obligations and are subordinated to all of our existing and future secured debt, including our Amended Credit Facility, to the extent of the value of the collateral securing such indebtedness. There are no significant restrictions on the ability of the Guarantors to make distributions to the Parent/Issuer. Certain subsidiaries and operating divisions of the Company do not guarantee the 2031, 2030 or 2028 Notes and are referred to as the Non-Guarantors.
The Guarantors jointly and severally, and fully and unconditionally, guarantee the payment of the principal and premium, if any, and interest on the 2031, 2030 and 2028 Notes when due, whether at stated maturity of the 2031, 2030 and 2028 Notes, by acceleration, call for redemption or otherwise, and all other obligations of the Company to the holders of the 2031, 2030 and 2028 Notes and to the trustee under the indenture governing the 2031, 2030 and 2028 Notes (the "Guarantee"). The Guarantees are senior unsecured obligations of each Guarantor and are of equal rank with all other existing and future senior indebtedness of the Guarantors.
The obligations of each Guarantor under its Guarantee shall be limited to the maximum amount, after giving effect to all other contingent and fixed liabilities of such Guarantor and to any collections from or payments made by or on behalf of any other Guarantor in
37
respect of the obligations of such Guarantor under the guarantee not constituting a fraudulent conveyance or fraudulent transfer under Federal or state law.
The Guarantee of a Guarantor will be released:
(1) upon any sale or other disposition of all or substantially all of the assets of that Guarantor (including by way of merger or consolidation), in accordance with the governing indentures, to any person other than the Company;
(2) if such Guarantor merges with and into the Company, with the Company surviving such merger;
(3) if the Guarantor is designated as an Unrestricted Subsidiary; or
(4) if the Company exercises its legal defeasance option or covenant defeasance option or the discharge of the Company's obligations under the indentures in accordance with the terms of the indentures.
The following tables present summarized financial information of the Parent/Issuer subsidiaries and the Guarantor subsidiaries. All intercompany balances and transactions between subsidiaries under Parent/Issuer and subsidiaries under the Guarantor have been eliminated. The information presented below excludes eliminations necessary to arrive at the information on a consolidated basis. In presenting the summarized financial statements, the equity method of accounting has been applied to the Parent/Issuer's interests in the Guarantor Subsidiaries. The summarized information excludes financial information of the Non-Guarantors, including earnings from and investments in these entities.
| Summarized Statements of Operations | |||||||||||||||||||||||
| (in thousands) | Fiscal Year Ended | Fiscal Year Ended | |||||||||||||||||||||
| September 24, 2022 | September 25, 2021 | ||||||||||||||||||||||
| (in thousands) | |||||||||||||||||||||||
| Parent/Issuer | Guarantors | Parent/Issuer | Guarantors | ||||||||||||||||||||
| Net sales | $ | 819,213 | $ | 2,198,460 | $ | 908,599 | $ | 2,142,925 | |||||||||||||||
| Gross profit | $ | 183,090 | $ | 709,635 | $ | 205,837 | $ | 686,332 | |||||||||||||||
| Income (loss) from operations | $ | (12,305) | $ | 243,293 | $ | 4,382 | $ | 229,961 | |||||||||||||||
| Equity in earnings of Guarantor subsidiaries | $ | 189,228 | $ | — | $ | 183,122 | $ | — | |||||||||||||||
| Net income (loss) | $ | (53,968) | $ | 189,228 | $ | (45,596) | $ | 183,122 | |||||||||||||||
| Summarized Balance Sheet Information | |||||||||||||||||||||||
| (in thousands) | As of | As of | |||||||||||||||||||||
| September 24, 2022 | September 25, 2021 | ||||||||||||||||||||||
| (in thousands) | |||||||||||||||||||||||
| Parent/Issuer | Guarantors | Parent/Issuer | Guarantors | ||||||||||||||||||||
| Current assets | $ | 455,381 | $ | 904,090 | $ | 670,030 | $ | 733,132 | |||||||||||||||
| Intercompany receivable from Non-guarantor subsidiaries | 309,238 | 61,794 | 229,795 | 61,633 | |||||||||||||||||||
| Other assets | 3,124,526 | 2,458,823 | 2,896,162 | 2,399,165 | |||||||||||||||||||
| Total assets | $ | 3,889,145 | $ | 3,424,707 | $ | 3,795,987 | $ | 3,193,930 | |||||||||||||||
| Current liabilities | $ | 162,793 | $ | 267,872 | $ | 185,996 | $ | 298,039 | |||||||||||||||
| Long-term debt | 1,185,891 | — | 1,184,024 | — | |||||||||||||||||||
| Other liabilities | 1,450,702 | 220,990 | 1,272,798 | 151,011 | |||||||||||||||||||
| Total liabilities | $ | 2,799,386 | $ | 488,862 | $ | 2,642,818 | $ | 449,050 | |||||||||||||||
38
Contractual Obligations
The table below presents our significant contractual cash obligations by fiscal year:
| Contractual Obligations | Fiscal 2023 |
Fiscal 2024 |
Fiscal 2025 |
Fiscal 2026 |
Fiscal 2027 |
Thereafter | Total | |||||||||||||||||||||||||||||||||||||
| (in millions) | ||||||||||||||||||||||||||||||||||||||||||||
| Long-term debt, including current maturities (1) | $ | 0.3 | $ | 0.2 | $ | 0.1 | $ | — | $ | — | $ | 1,200.0 | $ | 1,200.6 | ||||||||||||||||||||||||||||||
| Interest payment obligations (2) | 52.5 | 52.5 | 52.5 | 52.5 | 52.5 | 137.6 | 400.1 | |||||||||||||||||||||||||||||||||||||
| Operating leases | 52.6 | 46.3 | 37.3 | 24.9 | 15.4 | 38.3 | 214.8 | |||||||||||||||||||||||||||||||||||||
| Purchase commitments (3) | 184.8 | 47.1 | 26.0 | 16.1 | 9.0 | 2.2 | 285.2 | |||||||||||||||||||||||||||||||||||||
| Performance-based payments (4) | — | — | — | — | — | — | — | |||||||||||||||||||||||||||||||||||||
| Total | $ | 290.2 | $ | 146.1 | $ | 115.9 | $ | 93.5 | $ | 76.9 | $ | 1,378.1 | $ | 2,100.7 | ||||||||||||||||||||||||||||||
(1)Excludes $1.3 million of outstanding letters of credit related to normal business transactions. Debt repayments do not reflect the unamortized portion of deferred financing costs associated with the 2028 Notes, 2030 Notes and 2031 Notes of approximately $14.1 million as of September 24, 2022, of which, $2.5 million is amortizable until February 2028, $6.4 million is amortizable until October 2030 and $5.2 million is amortizable until April 2031, and is included in the carrying value of the long-term debt. See Note 11 - Long-Term Debt to the consolidated financial statements for further discussion of long-term debt.
(2)Estimated interest payments to be made on our 2028 Notes, our 2030 Notes and our 2031 Notes. See Note 11 - Long-Term Debt to the consolidated financial statements for description of interest rate terms.
(3)Contracts for purchases of grains, grass seed and pet food ingredients, used primarily to mitigate risk associated with increases in market prices and commodity availability, may obligate us to make future purchases based on estimated yields. The terms of these contracts vary; some having fixed prices or quantities, others having variable pricing and quantities. For certain agreements, management estimates are used to develop the quantities and pricing for anticipated purchases, and future purchases could vary significantly from such estimates.
(4)Possible performance-based payments associated with prior acquisitions of businesses are not included in the above table, because they are based on future performance of the businesses acquired, which is not yet known. Performance-based payments of approximately $0.2 million were made in fiscal 2022 related to Hydro-Organics Wholesale, Inc. Potential performance-based periods extend through fiscal 2025 for Hydro-Organics Wholesale, Inc. Payments are capped at $1.0 million per year related to Hydro-Organics Wholesale, Inc.
Recent Accounting Pronouncements
Refer to the discussion under Part II, Item 8, Notes to Consolidated Financial Statements, Note 1 – Organization and Significant Accounting Policies for a summary of recent accounting pronouncements.
Critical Accounting Policies, Estimates and Judgments
Our discussion and analysis of our financial condition and results of operations is based upon our consolidated financial statements, which have been prepared in accordance with accounting principles generally accepted in the United States of America. The preparation of these financial statements requires us to make estimates and judgments that affect the reported amounts and related disclosures in the consolidated financial statements. Estimates and assumptions are required for, but are not limited to, accounts receivable and inventory realizable values, fixed asset lives, long-lived asset valuation and impairments, intangible asset lives, stock-based compensation, deferred and current income taxes, self-insurance accruals and the impact of contingencies and litigation. We base our estimates on historical experience and on various other assumptions that are believed to be reasonable under the circumstances, the result of which forms the basis for making judgments about the carrying value of assets and liabilities that are not readily apparent from other sources. Actual results may differ from those estimates under different assumptions or conditions.
Although not all inclusive, we believe that the following represent the more critical accounting policies, which are subject to estimates and assumptions used in the preparation of our consolidated financial statements.
39
Goodwill
Goodwill represents the excess of cost of an acquired business over the fair value of the identifiable tangible and intangible assets acquired and liabilities assumed in a business combination. Identifiable intangible assets acquired in business combinations are recorded based on their fair values at the date of acquisition. Goodwill and identifiable intangible assets with indefinite lives are not subject to amortization but must be evaluated for impairment.
We test goodwill for impairment annually (as of the first day of the fourth fiscal quarter), or whenever events occur or circumstances change that would more likely than not reduce the fair value of a reporting unit below its carrying amount, by first assessing qualitative factors to determine whether it is more likely than not the fair value of the reporting unit is less than its carrying amount. The qualitative assessment evaluates factors including macro-economic conditions, industry-specific and company-specific considerations, legal and regulatory environments and historical performance. If it is determined that it is more likely than not the fair value of the reporting unit is greater than its carrying amount, it is unnecessary to perform the quantitative goodwill impairment test. If it is determined that it is more likely than not that the fair value of the reporting unit is less than its carrying amount, the quantitative test is performed to identify potential goodwill impairment. Based on certain circumstances, we may elect to bypass the qualitative assessment and proceed directly to performing the quantitative goodwill impairment test, which compares the estimated fair value of our reporting units to their related carrying values, including goodwill. Impairment is indicated if the estimated fair value of the reporting unit is less than its carrying value, and an impairment charge is recognized for the differential. Our goodwill impairment analysis also includes a comparison of the aggregate estimated fair value of our two reporting units to the Company’s total market capitalization.
Determining the fair value of a reporting unit involves the use of significant estimates and assumptions. The estimate of fair value of each of our reporting units is based on our projection of revenues, gross margin, operating costs and cash flows considering historical and estimated future results, general economic and market conditions as well as the impact of planned business and operational strategies. We base our fair value estimates on assumptions we believe to be reasonable at the time, but such assumptions are subject to inherent uncertainty. Assumptions critical to our fair value estimates were: (i) discount rates used in determining the fair value of the reporting units; (ii) estimated future cash flows; and (iii) projected revenue and operating profit growth rates used in the reporting unit models. Actual results may differ from those estimates. The valuations employ present value techniques to measure fair value and consider market factors.
Our goodwill is associated with our Pet segment and our Garden segment. In connection with our annual goodwill impairment testing performed during fiscal 2022, 2021 and 2020, we made a qualitative evaluation about the likelihood of goodwill impairment to determine whether it was necessary to calculate the estimated fair values of our reporting units under the quantitative goodwill impairment test. We completed our qualitative assessment of potential goodwill impairment and it was determined that it was more likely than not the fair values of our reporting units were greater than their carrying amounts, and accordingly, no quantitative testing of goodwill was required.
Changes in the judgments and estimates underlying our analysis of goodwill for possible impairment, including expected future cash flows and discount rates, could result in a significantly different estimate of the fair value of the reporting units in the future and could result in additional impairment of goodwill.
Intangible assets
Indefinite-lived intangible assets consist primarily of acquired trade names and trademarks. Indefinite-lived intangible assets are tested annually for impairment or whenever events or changes in circumstances occur indicating that the carrying amount of the asset may not be recoverable. An impairment loss would be recognized for an intangible asset with an indefinite useful life if its carrying value exceeds its fair value.
Indefinite-lived intangible assets are primarily tested for impairment by comparing the fair value of the asset to the carrying value. Fair value is determined based on discounted cash flow analyses that include significant management assumptions such as revenue growth rates, discount rates, weighted average cost of capital, and assumed royalty rates. Future net sales and short-term growth rates are estimated for trade names based on management’s forecasted financial results which consider key business drivers such as specific revenue growth initiatives, market share changes and general economic factors such as consumer spending.
During fiscal 2022, 2021 and 2020, we performed evaluations of the fair value of our indefinite-lived trade names and trademarks. Our expected revenues were based on our future operating plan and market growth or decline estimates for future years. No impairment was indicated during our fiscal 2022, 2021 and 2020 analyses of our indefinite-lived trade names and trademarks.
Acquisitions
In connection with businesses we acquire, management must determine the fair values of assets acquired and liabilities assumed. Considerable judgment and estimates are required to determine such amounts, particularly as they relate to identifiable intangible assets, and the applicable useful lives related thereto. Under different assumptions, the resulting valuations could be materially different, which could materially impact the operating results we report.
40
Our contractual commitments are presented under the caption Liquidity and Capital Resources.
Item 7A. Quantitative and Qualitative Disclosure About Market Risk
We are exposed to market risks, which include changes in U.S. interest rates and commodity prices and, to a lesser extent, foreign exchange rates. We do not engage in financial transactions for trading or speculative purposes.
Interest Rate Risk. The interest payable on our Amended Credit Facility is based on variable interest rates and therefore affected by changes in market interest rates. We had no variable rate debt outstanding as of September 24, 2022 under our Amended Credit Facility. However, if our Amended Credit Facility were fully drawn and interest rates changed by 25 basis points compared to actual rates, interest expense would have increased or decreased by approximately $1.9 million. In addition, we have investments consisting of cash equivalents and short-term investments, which are also affected by changes in market interest rates.
Commodity Prices. We are exposed to fluctuations in market prices for grains, grass seed, chemicals, fertilizer ingredients and pet food ingredients. To mitigate risk associated with increases in market prices and commodity availability, we enter into contracts for purchases, primarily to ensure commodity availability to us in the future. As of September 24, 2022, we had entered into fixed purchase commitments for commodities totaling approximately $285.2 million. A 10% change in the market price for these commodities would result in an additional pretax gain or loss of $28.5 million as the related inventory containing those inputs is sold.
Foreign Currency Risks. Our market risk associated with foreign currency rates is not considered to be material. To date, we have had minimal sales outside of the United States. Purchases made by our U.S. subsidiaries from foreign vendors are primarily made in U.S. dollars. Our international subsidiary transacts most of its business in British pounds. Therefore, we have only minimal exposure to foreign currency exchange risk. We do not hedge against foreign currency risks and believe that foreign currency exchange risk is immaterial to our current business.
41
Item 8. Financial Statements and Supplementary Data
See pages beginning at F-1.
Item 9. Changes in and Disagreements With Accountants on Accounting and Financial Disclosure
None.
Item 9A. Controls and Procedures
(a) Evaluation of Disclosure Controls and Procedures. Our Chief Executive Officer and Principal Financial Officer have reviewed, as of the end of the period covered by this report, the “disclosure controls and procedures” (as defined in the Securities Exchange Act of 1934 Rules 13a-15(e) and 15d-15(e)) that ensure that information relating to the Company required to be disclosed by us in the reports that we file or submit under the Exchange Act is recorded, processed, summarized and reported in a timely and proper manner and that such information is accumulated and communicated to our management, including our Chief Executive Officer and Principal Financial Officer, as appropriate to allow timely decisions regarding required disclosure. Based upon this review, such officers concluded that our disclosure controls and procedures were effective as of September 24, 2022.
(b) Changes in Internal Control Over Financial Reporting. Our management, with the participation of our Chief Executive Officer and Principal Financial Officer, has evaluated whether any change in our internal control over financial reporting occurred during the fourth quarter of fiscal 2022. Based on that evaluation, management concluded that there has been no change in our internal control over financial reporting during the fourth quarter of fiscal 2022 that has materially affected, or is reasonably likely to materially affect, our internal control over financial reporting.
(c) Management’s Report on Internal Control Over Financial Reporting. A copy of our management’s report and the report of Deloitte & Touche LLP, our independent registered public accounting firm, are included in our Financial Statements and Supplementary Data beginning on page F-1.
Item 9B. Other Information
None.
Item 9C. Disclosure Regarding Foreign Jurisdictions that Prevent Inspections
None.
PART III
Item 10. Directors, Executive Officers and Corporate Governance
We have adopted a code of ethics that applies to all of our executive officers and directors, a copy of which is available on our website at www.central.com/about-us/what-we-stand-for.
The remaining information required by this item is incorporated by reference from Central’s Definitive Proxy Statement for its 2023 Annual Meeting of Stockholders under the captions “Election of Directors,” “Further Information Concerning the Board of Directors – Committees of the Board”, “Delinquent Section 16(a) Reports” and “Code of Ethics.” See also Item 1 – Business above.
Item 11. Executive Compensation
The information required by this item is incorporated by reference from Central’s Definitive Proxy Statement for its 2023 Annual Meeting of Stockholders under the captions “Executive Compensation” and “Further Information Concerning the Board of Directors – Compensation Committee Interlocks and Insider Participation.”
42
Item 12. Security Ownership of Certain Beneficial Owners and Management and Related Stockholder Matters
The information required by this item is incorporated by reference from Central’s Definitive Proxy Statement for its 2023 Annual Meeting of Stockholders under the captions “Ownership of Management and Principal Stockholders” and Executive Compensation – “Equity Compensation Plan Information.”
Item 13. Certain Relationships and Related Transactions, and Director Independence
The information required by this item is incorporated by reference from Central’s Definitive Proxy Statement for its 2023 Annual Meeting of Stockholders under the captions “Further Information Concerning the Board of Directors – Board Independence” and “Transactions with the Company.”
Item 14. Principal Accountant Fees and Services
The information required by this item is incorporated by reference from Central’s Definitive Proxy Statement for its 2023 Annual Meeting of Stockholders under the caption “Independent Registered Public Accounting Firm.”
PART IV
Item 15. Exhibits and Financial Statement Schedules
(a)The following documents are filed as part of this report:
(i)Consolidated Financial Statements of Central Garden & Pet Company are attached to this Form 10-K beginning on page F-1:
Management’s Report on Internal Control Over Financial Reporting
Report of Independent Registered Public Accounting Firm
Consolidated Balance Sheets
Consolidated Statements of Operations
Consolidated Statements of Comprehensive Income (Loss)
Consolidated Statements of Shareholders’ Equity
Consolidated Statements of Cash Flows
Notes to Consolidated Financial Statements
All other schedules are omitted because of the absence of conditions under which they are required or because the required information is included in the consolidated financial statements or notes thereto.
(2)Exhibits:
Set forth below is a list of exhibits that are being filed or incorporated by reference into this Form 10-K:
43
| Incorporated by Reference | ||||||||||||||||||||||||||||||||||||||||||||
| Exhibit Number |
Exhibit | Form | File No. |
Exhibit | Filing Date |
Filed Herewith |
Filed, Not Furnished | |||||||||||||||||||||||||||||||||||||
| 8-K | 001-33268 | 2.1 | 2/17/2021 | |||||||||||||||||||||||||||||||||||||||||
| 10-Q | 001-33268 | 2.1 | 8/5/2021 | |||||||||||||||||||||||||||||||||||||||||
| 10-Q | 001-33268 | 2.2 | 8/5/2021 | |||||||||||||||||||||||||||||||||||||||||
| 10-Q | 001-33268 | 2.3 | 8/5/2021 | |||||||||||||||||||||||||||||||||||||||||
| 10-K | 001-33268 | 3.1 | 12/14/2006 | |||||||||||||||||||||||||||||||||||||||||
| 8-K | 001-33268 | 3.1 | 4/1/2022 | |||||||||||||||||||||||||||||||||||||||||
| 10-K | 001-33268 | 4.1 | 11/29/2017 | |||||||||||||||||||||||||||||||||||||||||
| 10-K | 001-33268 | 4.2 | 11/29/2017 | |||||||||||||||||||||||||||||||||||||||||
| 8-K | 001-33268 | 4.2 | 3/8/2010 | |||||||||||||||||||||||||||||||||||||||||
| 8-K | 001-33268 | 4.1 | 12/14/2017 | |||||||||||||||||||||||||||||||||||||||||
| 10-Q | 001-33268 | 4.1 | 5/7/2019 | |||||||||||||||||||||||||||||||||||||||||
| 10-Q | 001-33268 | 4.1 | 8/2/2019 | |||||||||||||||||||||||||||||||||||||||||
| 8-K | 001-33268 | 4.1 | 10/16/2020 | |||||||||||||||||||||||||||||||||||||||||
| 8-K | 001-33268 | 4.1 | 04/30/2021 | |||||||||||||||||||||||||||||||||||||||||
| 10-K | 001-33268 | 4.12 | 11/27/2019 | |||||||||||||||||||||||||||||||||||||||||
| 10-K | 001-33268 | 10.1 | 11/29/2017 | |||||||||||||||||||||||||||||||||||||||||
44
| Incorporated by Reference | ||||||||||||||||||||||||||||||||||||||||||||
| Exhibit Number |
Exhibit | Form | File No. |
Exhibit | Filing Date |
Filed Herewith |
Filed, Not Furnished | |||||||||||||||||||||||||||||||||||||
| 8-K | 001-33268 | 10.1 | 12/21/2021 | |||||||||||||||||||||||||||||||||||||||||
| 8-K | 001-33268 | 10.2 | 2/15/2012 | |||||||||||||||||||||||||||||||||||||||||
| 10-K | 000-20242 | 10.5.1 | 12/9/2004 | |||||||||||||||||||||||||||||||||||||||||
| 10-K | 000-20242 | 10.5.2 | 12/9/2004 | |||||||||||||||||||||||||||||||||||||||||
| 10-K | 001-33268 | 10.4.3 | 11/19/2010 | |||||||||||||||||||||||||||||||||||||||||
| 8-K | 001-33268 | 10.1 | 2/9/2022 | |||||||||||||||||||||||||||||||||||||||||
| 10-K | 001-33268 | 10.7 | 11/24/2020 | |||||||||||||||||||||||||||||||||||||||||
| 10-Q | 000-20242 | 10.6.1 | 2/3/2005 | |||||||||||||||||||||||||||||||||||||||||
| 10-Q | 000-20242 | 10.6.2 | 2/3/2005 | |||||||||||||||||||||||||||||||||||||||||
| 10-K/A | 000-20242 | 10.20 | 1/20/1999 | |||||||||||||||||||||||||||||||||||||||||
| 10-Q | 000-20242 | 10.7.1 | 8/8/2003 | |||||||||||||||||||||||||||||||||||||||||
| 8-K | 000-20242 | 10.1 | 4/14/2006 | |||||||||||||||||||||||||||||||||||||||||
| 10-K | 001-33268 | 10.7.2 | 11/26/2008 | |||||||||||||||||||||||||||||||||||||||||
| 10-Q | 001-33268 | 10.1 | 2/7/2013 | |||||||||||||||||||||||||||||||||||||||||
| 10-Q | 001-33268 | 10.1 | 2/5/2015 | |||||||||||||||||||||||||||||||||||||||||
45
| Incorporated by Reference | ||||||||||||||||||||||||||||||||||||||||||||
| Exhibit Number |
Exhibit | Form | File No. |
Exhibit | Filing Date |
Filed Herewith |
Filed, Not Furnished | |||||||||||||||||||||||||||||||||||||
| 10-K | 001-33268 | 10.16 | 11/29/2017 | |||||||||||||||||||||||||||||||||||||||||
| 10-K | 001-33268 | 10.17 | 11/28/2018 | |||||||||||||||||||||||||||||||||||||||||
| 10-Q | 001-33268 | 10.1 | 5/7/2020 | |||||||||||||||||||||||||||||||||||||||||
| 10-Q | 001-33268 | 10.2 | 5/5/2022 | |||||||||||||||||||||||||||||||||||||||||
| 8-K | 000-20242 | 10.1 | 10/14/2005 | |||||||||||||||||||||||||||||||||||||||||
| 8-K | 000-20242 | 10.2 | 10/14/2005 | |||||||||||||||||||||||||||||||||||||||||
| 10-K | 001-33268 | 10.24 | 12/10/2015 | |||||||||||||||||||||||||||||||||||||||||
| 8-K/A | 001-33268 | 10.1 | 6/7/2022 | |||||||||||||||||||||||||||||||||||||||||
| 8-K | 001-33268 | 10.1 | 9/19/2019 | |||||||||||||||||||||||||||||||||||||||||
| 8-K | 001-33268 | 10.1 | 10/3/2022 | |||||||||||||||||||||||||||||||||||||||||
| X | ||||||||||||||||||||||||||||||||||||||||||||
| X | ||||||||||||||||||||||||||||||||||||||||||||
| X | ||||||||||||||||||||||||||||||||||||||||||||
| X | ||||||||||||||||||||||||||||||||||||||||||||
| X | ||||||||||||||||||||||||||||||||||||||||||||
| X | ||||||||||||||||||||||||||||||||||||||||||||
| X | ||||||||||||||||||||||||||||||||||||||||||||
| 101 | The following financial statements from the Company's Annual Report on Form 10-K for the year ended September 24, 2022, formatted in Inline XBRL: (i) Consolidated Balance Sheet, (ii) Consolidated Statements of Operations, (iii) Consolidated Statements of Comprehensive Income, (iv) Consolidated Statements of Equity, (v) Consolidated Statements of Cash Flows, and (vi) Notes to Consolidated Financial Statements, tagged as block text and including detailed tags. | X | ||||||||||||||||||||||||||||||||||||||||||
| 104 | Cover Page Interactive Data File - the cover page iXBRL tags are embedded within the Inline XBRL document. | |||||||||||||||||||||||||||||||||||||||||||
46
| Incorporated by Reference | ||||||||||||||||||||||||||||||||||||||||||||
| Exhibit Number |
Exhibit | Form | File No. |
Exhibit | Filing Date |
Filed Herewith |
Filed, Not Furnished | |||||||||||||||||||||||||||||||||||||
| * | Management contract or compensatory plan or arrangement | |||||||||||||||||||||||||||||||||||||||||||
47
Item 16. Form 10-K Summary
Not applicable.
SIGNATURES
Pursuant to the requirements of Section 13 or 15(d) of the Securities Exchange Act of 1934, the registrant has duly caused this report to be signed on its behalf by the undersigned, thereunto duly authorized.
Date: November 22, 2022
| CENTRAL GARDEN & PET COMPANY | ||||||||
| By | /s/ Timothy P. Cofer | |||||||
| Timothy P. Cofer | ||||||||
| Chief Executive Officer | ||||||||
Pursuant to the requirements of the Securities Exchange Act of 1934, this report has been signed below by the following persons on behalf of the registrant and in the capacities indicated.
| Signature | Capacity | Date | ||||||||||||
| /s/ Timothy P. Cofer | Director and Chief Executive Officer (Principal Executive Officer) | November 22, 2022 | ||||||||||||
| Timothy P. Cofer | ||||||||||||||
| /s/ Nicholas Lahanas | Chief Financial Officer (Principal Financial Officer) |
November 22, 2022 | ||||||||||||
| Nicholas Lahanas | ||||||||||||||
| /s/ Howard A. Machek | Senior Vice President and Chief Accounting Officer (Principal Accounting Officer) |
November 22, 2022 | ||||||||||||
| Howard A. Machek | ||||||||||||||
| /s/ William E. Brown | Chairman | November 22, 2022 | ||||||||||||
| William E. Brown | ||||||||||||||
| /s/ Courtnee Chun | Director | November 22, 2022 | ||||||||||||
| Courtnee Chun | ||||||||||||||
| /s/ Lisa Coleman | Director | November 22, 2022 | ||||||||||||
| Lisa Coleman | ||||||||||||||
| /s/ Brendan P. Dougher | Director | November 22, 2022 | ||||||||||||
| Brendan P. Dougher | ||||||||||||||
| /s/ Michael J. Griffith | Director | November 22, 2022 | ||||||||||||
| Michael J. Griffith | ||||||||||||||
| /s/ Christopher Metz | Director | November 22, 2022 | ||||||||||||
| Christopher Metz | ||||||||||||||
| /s/ Daniel Myers | Director | November 22, 2022 | ||||||||||||
| Daniel Myers | ||||||||||||||
| /s/ Brooks M. Pennington III | Director | November 22, 2022 | ||||||||||||
| Brooks M. Pennington III | ||||||||||||||
| /s/ John R. Ranelli | Director | November 22, 2022 | ||||||||||||
| John R. Ranelli | ||||||||||||||
| /s/ Mary Beth Springer | Director | November 22, 2022 | ||||||||||||
| Mary Beth Springer | ||||||||||||||
48
INDEX TO CONSOLIDATED FINANCIAL STATEMENTS
| Central Garden & Pet Company | |||||
Report of Independent Registered Public Accounting Firm (PCAOB ID No. |
|||||
F-1
MANAGEMENT’S REPORT ON INTERNAL CONTROL OVER FINANCIAL REPORTING
Central Garden & Pet Company’s management, under the supervision of Central’s Chief Executive Officer and Principal Financial Officer, is responsible for establishing and maintaining effective internal control over financial reporting (as defined in Rule 13a-15(f) or 15d-15(f) under the Exchange Act). Management evaluated the effectiveness of Central’s internal control over financial reporting based on the framework in Internal Control – Integrated Framework (2013) issued by the Committee of Sponsoring Organizations (“COSO”) of the Treadway Commission. The scope of management's assessment of the effectiveness of our internal control over financial reporting included all of our consolidated operations.
Based on evaluation of the criteria set forth by COSO in Internal Control – Integrated Framework (2013), management concluded that our internal control over financial reporting was effective as of September 24, 2022.
Our independent registered public accounting firm, Deloitte & Touche LLP, has issued a report on our internal control over financial reporting, which appears on page F-3 of this Form 10-K.
Because of the inherent limitations of internal control over financial reporting, including the possibility of collusion or improper management override of controls, material misstatements due to error or fraud may not be prevented or detected on a timely basis. Also, projections of any evaluation of the effectiveness of the internal control over financial reporting to future periods are subject to the risk that the controls may become ineffective because of changes in conditions, or that the degree of compliance with the policies or procedures may deteriorate.
F-2
REPORT OF INDEPENDENT REGISTERED PUBLIC ACCOUNTING FIRM
To the shareholders and the Board of Directors of Central Garden & Pet Company
Opinions on the Financial Statements and Internal Control over Financial Reporting
We have audited the accompanying consolidated balance sheets of Central Garden & Pet Company and subsidiaries (the "Company") as of September 24, 2022 and September 25, 2021, the related consolidated statements of operations, comprehensive income, equity, and cash flows, for each of the fiscal years ended September 24, 2022, September 25, 2021, and September 26, 2020, and the related notes (collectively referred to as the "financial statements"). We also have audited the Company’s internal control over financial reporting as of September 24, 2022, based on criteria established in Internal Control — Integrated Framework (2013) issued by the Committee of Sponsoring Organizations of the Treadway Commission (COSO).
In our opinion, the financial statements referred to above present fairly, in all material respects, the financial position of the Company as of September 24, 2022 and September 25, 2021, and the results of its operations and its cash flows for each of the fiscal years in ended September 24, 2022, September 25, 2021, and September 26, 2020, in conformity with accounting principles generally accepted in the United States of America. Also, in our opinion, the Company maintained, in all material respects, effective internal control over financial reporting as of September 24, 2022, based on criteria established in Internal Control — Integrated Framework (2013) issued by COSO.
Basis for Opinions
The Company’s management is responsible for these financial statements, for maintaining effective internal control over financial reporting, and for its assessment of the effectiveness of internal control over financial reporting, included in the accompanying Management’s Report on Internal Control over Financial Reporting. Our responsibility is to express an opinion on these financial statements and an opinion on the Company’s internal control over financial reporting based on our audits. We are a public accounting firm registered with the Public Company Accounting Oversight Board (United States) (PCAOB) and are required to be independent with respect to the Company in accordance with the U.S. federal securities laws and the applicable rules and regulations of the Securities and Exchange Commission and the PCAOB.
We conducted our audits in accordance with the standards of the PCAOB. Those standards require that we plan and perform the audits to obtain reasonable assurance about whether the financial statements are free of material misstatement, whether due to error or fraud, and whether effective internal control over financial reporting was maintained in all material respects.
Our audits of the financial statements included performing procedures to assess the risks of material misstatement of the financial statements, whether due to error or fraud, and performing procedures to respond to those risks. Such procedures included examining, on a test basis, evidence regarding the amounts and disclosures in the financial statements. Our audits also included evaluating the accounting principles used and significant estimates made by management, as well as evaluating the overall presentation of the financial statements. Our audit of internal control over financial reporting included obtaining an understanding of internal control over financial reporting, assessing the risk that a material weakness exists, and testing and evaluating the design and operating effectiveness of internal control based on the assessed risk. Our audits also included performing such other procedures as we considered necessary in the circumstances. We believe that our audits provide a reasonable basis for our opinions.
Definition and Limitations of Internal Control over Financial Reporting
A company’s internal control over financial reporting is a process designed to provide reasonable assurance regarding the reliability of financial reporting and the preparation of financial statements for external purposes in accordance with generally accepted accounting principles. A company’s internal control over financial reporting includes those policies and procedures that (1) pertain to the maintenance of records that, in reasonable detail, accurately and fairly reflect the transactions and dispositions of the assets of the company; (2) provide reasonable assurance that transactions are recorded as necessary to permit preparation of financial statements in accordance with generally accepted accounting principles, and that receipts and expenditures of the company are being made only in accordance with authorizations of management and directors of the
F-3
company; and (3) provide reasonable assurance regarding prevention or timely detection of unauthorized acquisition, use, or disposition of the company’s assets that could have a material effect on the financial statements.
Because of its inherent limitations, internal control over financial reporting may not prevent or detect misstatements. Also, projections of any evaluation of effectiveness to future periods are subject to the risk that controls may become inadequate because of changes in conditions, or that the degree of compliance with the policies or procedures may deteriorate.
Critical Audit Matter
The critical audit matter communicated below is a matter arising from the current-period audit of the financial statements that was communicated or required to be communicated to the audit committee and that (1) relates to accounts or disclosures that are material to the financial statements and (2) involved our especially challenging, subjective, or complex judgments. The communication of critical audit matters does not alter in any way our opinion on the financial statements, taken as a whole, and we are not, by communicating the critical audit matter below, providing a separate opinion on the critical audit matter or on the accounts or disclosures to which it relates.
Acquisitions –Refer to Note 3 to the financial statements
Critical Audit Matter Description
Green Garden Products— On February 11, 2021, the Company acquired Flora Parent, Inc. and its subsidiaries ("Green Garden Products"), a leading provider of vegetable, herb and flower seed packets, seed starters and plant nutrients in North America, for approximately $571 million. The Company finalized the allocation of the purchase price during fiscal year 2022.
D&D Commodities Limited—On June 30, 2021, the Company purchased D&D Commodities, Ltd. ("D&D"), a provider of high-quality, premium bird feed, for approximately $88 million in cash and the assumption of approximately $30 million of long-term debt. The Company finalized the allocation of the purchase price during fiscal year 2022.
We identified the accounting for these acquisitions as a critical audit matter due to the complexity of the agreements and the significant judgments made by management in (1) evaluating the purchase and other agreements entered into on or around the acquisition dates to identify the accounting treatment for different elements contained in each agreement, and (2) determining the weighted-average cost of capital (WACC), including the discount rate to be used in the valuation. Auditing these acquisitions required significant audit effort in the form of more experienced personnel reading the purchase and other agreements to identify, analyze, and conclude on the reasonableness of management's accounting treatment for the different elements, including the purchase price recorded. In addition, we used our fair value specialists to (1) evaluate the reasonableness of the WACC and discount rate utilized in the valuation and (2) evaluate the reasonableness of key assumptions used.
How the Critical Audit Matter Was Addressed in the Audit
Our audit procedures related to acquisitions included the following, among others:
We tested the effectiveness of controls over the valuation methodology of acquired companies, including management’s controls over the selection of the WACC and discount rates as well as controls over the review of the purchase and other agreements for complex accounting matters and associated accounting analysis.
We utilized more experienced personnel to read and analyze the purchase and other agreements entered into on or around the acquisition date to identify and conclude on the reasonableness of management’s accounting treatment for the different elements, including the purchase price recorded.
With the assistance of fair value specialists, we evaluated the reasonableness of the WACC and discount rate by:
- Performing risk assessment procedures over the source information underlying the determination of the WACC and discount rate and testing the mathematical accuracy of the calculation.
F-4
- Developing a range of independent estimates and comparing those to the WACC and discount rates selected by management.
/s/ DELOITTE & TOUCHE LLP
November 22, 2022
We have served as the Company's auditor since at least 1987; however, an earlier year could not be reliably determined.
F-5
CENTRAL GARDEN & PET COMPANY
CONSOLIDATED BALANCE SHEETS
| September 24, 2022 | September 25, 2021 | |||||||||||||
| (in thousands) | ||||||||||||||
| ASSETS | ||||||||||||||
| Current assets: | ||||||||||||||
| Cash and cash equivalents | $ | $ | ||||||||||||
| Restricted cash | ||||||||||||||
| Accounts receivable, net | ||||||||||||||
| Inventories, net | ||||||||||||||
| Prepaid expenses and other | ||||||||||||||
| Total current assets | ||||||||||||||
| Plant, property and equipment, net | ||||||||||||||
| Goodwill | ||||||||||||||
| Other intangible assets, net | ||||||||||||||
| Operating lease right-of-use assets | ||||||||||||||
| Other assets | ||||||||||||||
| Total | $ | $ | ||||||||||||
| LIABILITIES AND EQUITY | ||||||||||||||
| Current liabilities: | ||||||||||||||
| Accounts payable | $ | $ | ||||||||||||
| Accrued expenses | ||||||||||||||
| Current lease liabilities | ||||||||||||||
| Current portion of long-term debt | ||||||||||||||
| Total current liabilities | ||||||||||||||
| Long-term debt | ||||||||||||||
| Long-term lease liabilities | ||||||||||||||
| Deferred income taxes and other long-term obligations | ||||||||||||||
Commitments and contingencies (Note 12)
|
||||||||||||||
| Equity: | ||||||||||||||
| Common stock | ||||||||||||||
| Class A common stock | ||||||||||||||
| Class B stock | ||||||||||||||
| Additional paid-in capital | ||||||||||||||
| Retained earnings | ||||||||||||||
| Accumulated other comprehensive loss | ( |
( |
||||||||||||
| Total Central Garden & Pet shareholders’ equity | ||||||||||||||
| Noncontrolling interest | ||||||||||||||
| Total equity | ||||||||||||||
| Total | $ | $ | ||||||||||||
See notes to consolidated financial statements.
F-6
CENTRAL GARDEN & PET COMPANY
CONSOLIDATED STATEMENTS OF OPERATIONS
| Fiscal Year Ended | ||||||||||||||||||||
| September 24, 2022 | September 25, 2021 | September 26, 2020 | ||||||||||||||||||
| (in thousands, except per share amounts) | ||||||||||||||||||||
| Net sales | $ | $ | $ | |||||||||||||||||
| Cost of goods sold | ||||||||||||||||||||
| Gross profit | ||||||||||||||||||||
| Selling, general and administrative expenses | ||||||||||||||||||||
| Operating income | ||||||||||||||||||||
| Interest expense | ( |
( |
( |
|||||||||||||||||
| Interest income | ||||||||||||||||||||
| Other expense, net | ( |
( |
( |
|||||||||||||||||
| Income before income taxes and noncontrolling interest | ||||||||||||||||||||
| Income tax expense | ||||||||||||||||||||
| Net income including noncontrolling interest | ||||||||||||||||||||
| Net income attributable to noncontrolling interest | ||||||||||||||||||||
| Net income attributable to Central Garden & Pet Company | $ | $ | $ | |||||||||||||||||
| Net income per share attributable to Central Garden & Pet Company: | ||||||||||||||||||||
| Basic | $ | $ | $ | |||||||||||||||||
| Diluted | $ | $ | $ | |||||||||||||||||
| Weighted average shares used in the computation of net income per share: | ||||||||||||||||||||
| Basic | ||||||||||||||||||||
| Diluted | ||||||||||||||||||||
See notes to consolidated financial statements.
F-7
CENTRAL GARDEN & PET COMPANY
CONSOLIDATED STATEMENTS OF COMPREHENSIVE INCOME
| Fiscal Year Ended | ||||||||||||||||||||
| September 24, 2022 | September 25, 2021 | September 26, 2020 | ||||||||||||||||||
| (in thousands) | ||||||||||||||||||||
| Net income | $ | $ | $ | |||||||||||||||||
| Other comprehensive income (loss): | ||||||||||||||||||||
| Foreign currency translation | ( |
|||||||||||||||||||
| Total comprehensive income | ||||||||||||||||||||
| Comprehensive income attributable to noncontrolling interests | ||||||||||||||||||||
| Comprehensive income attributable to Central Garden & Pet Company | $ | $ | $ | |||||||||||||||||
See notes to consolidated financial statements.
F-8
CENTRAL GARDEN & PET COMPANY
CONSOLIDATED STATEMENTS OF EQUITY
| Central Garden & Pet Company | |||||||||||||||||||||||||||||||||||||||||||||||||||||||||||||||||||||||
| (in thousands, except per share amounts) | |||||||||||||||||||||||||||||||||||||||||||||||||||||||||||||||||||||||
| Common Stock | Class A Common Stock |
Class B Stock | Additional Paid-in Capital |
Retained Earnings |
Accumulated Other Comprehensive Income (Loss) |
Total | Non-controlling Interest |
Total Equity | |||||||||||||||||||||||||||||||||||||||||||||||||||||||||||||||
| Shares | Amount | Shares | Amount | Shares | Amount | ||||||||||||||||||||||||||||||||||||||||||||||||||||||||||||||||||
| Balance, September 28, 2019 | $ | $ | $ | $ | $ | $ | ( |
$ | $ | $ | |||||||||||||||||||||||||||||||||||||||||||||||||||||||||||||
| Amortization of share-based awards | — | — | — | — | — | — | — | — | — | ||||||||||||||||||||||||||||||||||||||||||||||||||||||||||||||
| Repurchase of stock | ( |
( |
( |
( |
— | — | ( |
( |
— | ( |
— | ( |
|||||||||||||||||||||||||||||||||||||||||||||||||||||||||||
| Restricted share activity | — | — | — | — | ( |
— | — | ( |
— | ( |
|||||||||||||||||||||||||||||||||||||||||||||||||||||||||||||
| Share conversion | — | — | — | ( |
— | — | — | — | — | — | — | ||||||||||||||||||||||||||||||||||||||||||||||||||||||||||||
| Issuance of common stock | — | — | — | — | — | — | — | ||||||||||||||||||||||||||||||||||||||||||||||||||||||||||||||||
| Distribution to noncontrolling interest | — | — | — | — | — | — | — | — | — | — | ( |
( |
|||||||||||||||||||||||||||||||||||||||||||||||||||||||||||
| Other comprehensive loss | — | — | — | — | — | — | — | — | — | ||||||||||||||||||||||||||||||||||||||||||||||||||||||||||||||
| Net income | — | — | — | — | — | — | — | — | |||||||||||||||||||||||||||||||||||||||||||||||||||||||||||||||
| Balance, September 26, 2020 | ( |
||||||||||||||||||||||||||||||||||||||||||||||||||||||||||||||||||||||
| Amortization of share-based awards | — | — | — | — | — | — | — | — | — | ||||||||||||||||||||||||||||||||||||||||||||||||||||||||||||||
| Restricted share activity | — | — | — | — | ( |
— | — | ( |
— | ( |
|||||||||||||||||||||||||||||||||||||||||||||||||||||||||||||
| Issuance of common stock | — | — | — | — | — | — | — | ||||||||||||||||||||||||||||||||||||||||||||||||||||||||||||||||
| Distribution to noncontrolling interest | — | — | — | — | — | — | — | — | — | — | ( |
( |
|||||||||||||||||||||||||||||||||||||||||||||||||||||||||||
| Repurchase of stock | ( |
( |
( |
— | — | ( |
( |
— | ( |
— | ( |
||||||||||||||||||||||||||||||||||||||||||||||||||||||||||||
| Other comprehensive loss | — | — | — | — | — | — | — | — | — | ||||||||||||||||||||||||||||||||||||||||||||||||||||||||||||||
| Net income | — | — | — | — | — | — | — | — | |||||||||||||||||||||||||||||||||||||||||||||||||||||||||||||||
| Balance, September 25, 2021 | ( |
||||||||||||||||||||||||||||||||||||||||||||||||||||||||||||||||||||||
| Amortization of share-based awards | — | — | — | — | — | — | — | — | — | ||||||||||||||||||||||||||||||||||||||||||||||||||||||||||||||
| Restricted share activity | — | — | — | — | ( |
— | — | ( |
— | ( |
|||||||||||||||||||||||||||||||||||||||||||||||||||||||||||||
| Issuance of common stock | — | — | — | — | — | — | — | ||||||||||||||||||||||||||||||||||||||||||||||||||||||||||||||||
| Distribution to noncontrolling interest | — | — | — | — | — | — | — | — | — | — | ( |
( |
|||||||||||||||||||||||||||||||||||||||||||||||||||||||||||
| Repurchase of stock | ( |
— | ( |
( |
— | — | ( |
( |
— | ( |
— | ( |
|||||||||||||||||||||||||||||||||||||||||||||||||||||||||||
| Other comprehensive loss | — | — | — | — | — | — | — | — | ( |
( |
— | ( |
|||||||||||||||||||||||||||||||||||||||||||||||||||||||||||
| Net income | — | — | — | — | — | — | — | — | |||||||||||||||||||||||||||||||||||||||||||||||||||||||||||||||
| Balance, September 24, 2022 | $ | $ | $ | $ | $ | $ | ( |
$ | $ | $ | |||||||||||||||||||||||||||||||||||||||||||||||||||||||||||||
See notes to consolidated financial statements
F-9
CENTRAL GARDEN & PET COMPANY
CONSOLIDATED STATEMENTS OF CASH FLOWS
| Fiscal Year Ended | |||||||||||||||||
| September 24, 2022 | September 25, 2021 | September 26, 2020 | |||||||||||||||
| (in thousands) | |||||||||||||||||
| Cash flows from operating activities: | |||||||||||||||||
| Net income | $ | $ | $ | ||||||||||||||
| Adjustments to reconcile net income to net cash provided by operating activities: | |||||||||||||||||
| Depreciation and amortization | |||||||||||||||||
| Amortization of deferred financing costs | |||||||||||||||||
| Non-cash lease expense | |||||||||||||||||
| Stock-based compensation | |||||||||||||||||
| Debt extinguishment costs | |||||||||||||||||
| Loss on sale of business | |||||||||||||||||
| Deferred income taxes | ( |
( |
|||||||||||||||
| Loss (gain) on disposal of property, plant and equipment | ( |
||||||||||||||||
| Asset impairments | |||||||||||||||||
| Other | ( |
||||||||||||||||
| Changes in assets and liabilities (excluding businesses acquired): | |||||||||||||||||
| Receivables | ( |
||||||||||||||||
| Inventories | ( |
( |
|||||||||||||||
| Prepaid expenses and other assets | ( |
||||||||||||||||
| Accounts payable | ( |
||||||||||||||||
| Accrued expenses | ( |
||||||||||||||||
| Other long-term obligations | ( |
( |
|||||||||||||||
| Operating lease liabilities | ( |
( |
( |
||||||||||||||
| Net cash (used in) provided by operating activities | ( |
||||||||||||||||
| Cash flows from investing activities: | |||||||||||||||||
| Additions to property, plant and equipment | ( |
( |
( |
||||||||||||||
| Businesses acquired, net of cash acquired | ( |
||||||||||||||||
| Proceeds from sale of business | |||||||||||||||||
| Payments for investments | ( |
( |
( |
||||||||||||||
| Other investing activities | ( |
( |
|||||||||||||||
| Net cash used in investing activities | ( |
( |
( |
||||||||||||||
| Cash flows from financing activities: | |||||||||||||||||
| Repayments on revolving line of credit | ( |
( |
|||||||||||||||
| Borrowings on revolving line of credit | |||||||||||||||||
| Premium paid on extinguishment of debt | ( |
||||||||||||||||
| Repayments of long-term debt | ( |
( |
( |
||||||||||||||
| Issuance of long-term debt | |||||||||||||||||
| Repurchase of common stock, including shares surrendered for tax withholding | ( |
( |
( |
||||||||||||||
| Payments of contingent consideration | ( |
( |
( |
||||||||||||||
| Distribution to noncontrolling interest | ( |
( |
( |
||||||||||||||
| Payment of financing costs | ( |
( |
( |
||||||||||||||
| Net cash (used in) provided by financing activities | ( |
( |
|||||||||||||||
| Effect of exchange rate changes on cash and equivalents | ( |
||||||||||||||||
| Net (decrease) increase in cash, cash equivalents and restricted cash | ( |
( |
|||||||||||||||
| Cash, cash equivalents and restricted cash at beginning of year | |||||||||||||||||
| Cash, cash equivalents and restricted cash at end of year | $ | $ | $ | ||||||||||||||
| Supplemental information: | |||||||||||||||||
| Cash paid for interest | $ | $ | $ | ||||||||||||||
| Cash paid for income taxes – net of refunds | |||||||||||||||||
| Non-cash investing and financing activities: | |||||||||||||||||
| Capital expenditures incurred but not paid | |||||||||||||||||
| Liability for contingent performance based payments | ( |
||||||||||||||||
| Shares of common stock repurchased but not settled | |||||||||||||||||
| Operating lease right of use assets recognized at ASC 842 transition | |||||||||||||||||
| Operating lease liabilities recognized at ASC 842 transition | |||||||||||||||||
| Operating lease right of use assets recognized after ASC 842 transition | |||||||||||||||||
See notes to consolidated financial statements.
F-10
CENTRAL GARDEN & PET COMPANY
NOTES TO CONSOLIDATED FINANCIAL STATEMENTS
Fiscal Years Ended September 24, 2022,
September 25, 2021, and September 26, 2020
1. Organization and Significant Accounting Policies
Revenue Recognition and Nature of Products and Services
The Company manufactures, markets and distributes a wide variety of branded, private label and third-party pet and garden products to wholesalers, distributors and retailers, primarily in the United States. The majority of the Company’s revenue is generated from the sale of finished pet and garden products. The Company also recognizes a minor amount of non-product revenue (approximately one percent of consolidated net sales) comprising third-party logistics services, merchandising services and royalty income from sales-based licensing arrangements. Product and non-product revenue is recognized when performance obligations under the terms of the contracts with customers are satisfied. The Company recognizes product revenue when control over the finished goods transfers to its customers, which generally occurs upon shipment to, or receipt at, customers’ locations, as determined by the specific terms of the contract. These revenue arrangements generally have single performance obligations. Non-product revenue is recognized as the services are provided to the customer in the case of third-party logistics services and merchandising services, or as third-party licensee sales occur for royalty income. Revenue, which includes shipping and handling charges billed to the customer, is reported net of variable consideration and consideration payable to our customers, including applicable discounts, returns, allowances, trade promotion, unsaleable product, consumer coupon redemption and rebates. The amount billed to customers for shipping and handling costs included in net sales for the fiscal years ended September 24, 2022, September 25, 2021 and September 26, 2020 was $15.8 million, $13.1 million and $12.5 million, respectively. Shipping and handling costs that occur before the customer obtains control of the goods are deemed to be fulfillment activities and are accounted for as fulfillment costs.
Key sales terms are established on a frequent basis such that most customer arrangements and related incentives have a one year or shorter duration. As such, the Company does not capitalize contract inception costs. The Company generally does not have unbilled receivables at the end of a period. Deferred revenues are not material and primarily include advance payments for services that have yet to be rendered. The Company does not receive noncash consideration for the sale of goods. Amounts billed and due from our customers are classified as receivables and require payment on a short-term basis; therefore, the Company does not have any significant financing components.
F-11
CENTRAL GARDEN & PET COMPANY
NOTES TO CONSOLIDATED FINANCIAL STATEMENTS (Continued)
Sales Incentives and Other Promotional Programs
The Company routinely offers sales incentives and discounts through various regional and national programs to its customers and consumers. These programs include product discounts or allowances, product rebates, product returns, one-time or ongoing trade-promotion programs with customers and consumer coupon programs that require the Company to estimate and accrue the expected costs of such programs. The costs associated with these activities are accounted for as reductions to the transaction price of the Company’s products and are, therefore, recorded as reductions to gross sales at the time of sale. The Company bases its estimates of incentive costs on historical trend experience with similar programs, actual incentive terms per customer contractual obligations and expected levels of performance of trade promotions, utilizing customer and sales organization inputs. The Company maintains liabilities at the end of each period for the estimated incentive costs incurred but unpaid for these programs. Differences between estimated and actual incentive costs are generally not material and are recognized in earnings in the period such differences are determined. Reserves for product returns, accrued rebates and promotional accruals are included in the consolidated balance sheets as part of accrued expenses, and the value of inventory associated with reserves for sales returns is included within prepaid and other current assets on the consolidated balance sheets.
401(k) Plans – The Company sponsors several 401(k) plans which cover substantially all employees. The Company’s matching contributions expensed under these plans were $7.2 million for fiscal 2022, $6.8 million for fiscal 2021 and $6.4 million for fiscal 2020. In fiscal 2022, 2021 and 2020, the Company’s matching contributions made in the Company’s Class A common stock resulted in the issuance of approximately 170,000 , 159,000 and 218,000 shares, respectively.
| September 24, 2022 | September 25, 2021 | September 26, 2020 | |||||||||||||||
| (in thousands) | |||||||||||||||||
| Cash and cash equivalents | $ | $ | $ | ||||||||||||||
| Restricted cash | |||||||||||||||||
| Total cash, cash equivalents and restricted cash | $ | $ | $ | ||||||||||||||
F-12
CENTRAL GARDEN & PET COMPANY
NOTES TO CONSOLIDATED FINANCIAL STATEMENTS (Continued)
Leases -The Company determines whether an arrangement contains a lease at inception by determining if the contract conveys the right to control the use of identified property, plant or equipment for a period of time in exchange for consideration and other facts and circumstances. Long-term operating lease right-of-use ("ROU") assets and current and long-term operating lease liabilities are presented separately in the consolidated balance sheets. Finance lease ROU assets are presented in property, plant and equipment, net, and the related finance liabilities are presented with current and long-term debt in the consolidated balance sheets.
Lease ROU assets represent the Company's right to use an underlying asset for the lease term, and lease liabilities represent the Company's obligation to make lease payments arising from the lease. ROU assets are calculated based on the lease liability adjusted for any lease payments paid to the lessor at or before the commencement date and excludes any lease incentives received from the lessor. Lease liabilities are recognized based on the present value of the future minimum lease payments over the lease term. The lease term may include options to extend or terminate the lease when it is reasonably certain that the Company will exercise that option. As the Company's leases typically do not contain a readily determinable implicit rate, the Company determines the present value of the lease liability using its
F-13
CENTRAL GARDEN & PET COMPANY
NOTES TO CONSOLIDATED FINANCIAL STATEMENTS (Continued)
Recent Accounting Pronouncements
Accounting Pronouncements Recently Adopted
Accounting for Income Taxes
In December 2019, the Financial Accounting Standards Board ("FASB") issued Accounting Standards Update ("ASU") 2019-12, Income Taxes (Topic 740), Simplifying the Accounting for Income Taxes, which eliminates certain exceptions related to the approach for intraperiod tax allocation, the methodology for calculating taxes during the quarters and the recognition of deferred tax liabilities for outside basis differences. This guidance also simplifies aspects of the accounting for franchise taxes and enacted changes in tax laws or rates, and clarifies the accounting for transactions that result in a step-up in the tax basis of goodwill. ASU 2019-12 was effective for the Company as of September 26, 2021, and the adoption of this standard did not have a material impact on the Company's condensed consolidated financial statements.
2. Fair Value Measurements
Generally accepted accounting principles require financial assets and liabilities to be categorized based on the inputs used to calculate their fair values as follows:
Level 1 – Quoted prices in active markets for identical assets or liabilities.
Level 2 – Inputs other than quoted prices included within Level 1 that are observable for the asset or liability, either directly or indirectly.
F-14
CENTRAL GARDEN & PET COMPANY
NOTES TO CONSOLIDATED FINANCIAL STATEMENTS (Continued)
Level 3 – Unobservable inputs for the asset or liability, which reflect the Company’s own assumptions about the assumptions that market participants would use in pricing the asset or liability (including assumptions about risk).
The Company’s financial instruments include cash and equivalents, restricted cash and equivalents, short term investments, accounts receivable and payable, derivative instruments, short-term borrowings, and accrued liabilities. The carrying amount of these instruments approximates fair value because of their short-term nature.
Assets and Liabilities Measured at Fair Value on a Recurring Basis
The following table presents the Company’s financial assets and liabilities measured at fair value on a recurring basis based upon the level within the fair value hierarchy in which the fair value measurements fall, as of September 24, 2022:
| Level 1 | Level 2 | Level 3 | Total | ||||||||||||||||||||
| (in thousands) | |||||||||||||||||||||||
| Liabilities: | |||||||||||||||||||||||
| Liability for contingent consideration (a) | $ | $ | $ | $ | |||||||||||||||||||
| Total liabilities | $ | $ | $ | $ | |||||||||||||||||||
The following table presents our financial assets and liabilities at fair value on a recurring basis based upon the level within the fair value hierarchy in which the fair value measurements fall, as of September 25, 2021:
| Level 1 | Level 2 | Level 3 | Total | ||||||||||||||||||||
| (in thousands) | |||||||||||||||||||||||
| Liabilities: | |||||||||||||||||||||||
| Liability for contingent consideration (a) | $ | $ | $ | $ | |||||||||||||||||||
| Total liabilities | $ | $ | $ | $ | |||||||||||||||||||
(a)The fair values of the Company's contingent consideration liabilities from previous business acquisitions are considered "Level 3" measurements because the Company uses various estimates in the valuation models to project timing and amount of future contingent payments. The liability for contingent consideration relates to future performance-based contingent payments for Hydro-Organics Wholesale, Inc., acquired in October 2015. The performance period related to Hydro-Organics Wholesale extends through fiscal year 2025. The fair value of the estimated contingent consideration arrangement is determined based on the Company’s evaluation as to the probability and amount of any earn-out that will be achieved based on expected future performance by the acquired entity. This is presented as part of long-term liabilities in the Company's consolidated balance sheets.
| Amount | |||||
| (in thousands) | |||||
| Balance as of September 25, 2021 | $ | ||||
| Changes in the fair value of contingent performance-based payments | ( |
||||
| Performance-based payments made | ( |
||||
| Balance as of September 24, 2022 | $ | ||||
Assets and Liabilities Measured at Fair Value on a Non-Recurring Basis
The Company measures certain non-financial assets and liabilities, including long-lived assets, goodwill and intangible assets, at fair value on a non-recurring basis. Fair value measurements of non-financial assets and non-financial liabilities are used primarily in the impairment analyses of long-lived assets, goodwill and other intangible assets. There were no
F-15
CENTRAL GARDEN & PET COMPANY
NOTES TO CONSOLIDATED FINANCIAL STATEMENTS (Continued)
Fair Value of Other Financial Instruments
In April 2021, the Company issued $400 million aggregate principal amount of 4.125 % senior notes due April 2031 (the "2031 Notes"). The estimated fair value of the Company's 2031 Notes as of September 24, 2022 and September 25, 2021 was $327.6 million and $408.5 million compared to a carrying value of $394.8 million and $394.2 million, respectively.
In October 2020, the Company issued $500 million aggregate principal amount of 4.125 % senior notes due October 2030 (the "2030 Notes"). The estimated fair value of the Company's 2030 Notes as of September 24, 2022 and September 25, 2021 was $407.6 million and $517.2 million compared to a carrying value of $493.6 million and $492.8 million, respectively.
In December 2017, the Company issued $300 million aggregate principal amount of 5.125 % senior notes due February 2028 (the "2028 Notes"). The estimated fair value of the Company's 2028 Notes as of September 24, 2022 and September 25, 2021 was $272.2 million and $318.6 million, respectively, compared to a carrying value of $297.5 million and $297.0 million, respectively.
In November 2020, the Company redeemed $400 million aggregate principal amount of 6.125 % senior notes due November 2023 (the “2023 Notes”) at a price of 101.531 %.
The estimated fair value is based on quoted market prices for these notes, which are Level 1 inputs within the fair value hierarchy.
3. Acquisitions and Investments in Joint Ventures
Fiscal 2022
The Company did not make any acquisitions in fiscal 2022. During the second quarter and fourth quarter of fiscal 2022, the Company finalized the allocation of the purchase price to the fair values of the tangible assets, intangible assets and liabilities acquired for its acquisitions of Green Garden Products and D&D Commodities Limited, respectively.
Green Garden Products
On February 11, 2021, the Company acquired Flora Parent, Inc. and its subsidiaries ("Green Garden Products"), a leading provider of vegetable, herb and flower seed packets, seed starters and plant nutrients in North America, for approximately $571 million. The Company borrowed approximately $180 million under its credit facility to partially finance the acquisition. The purchase price exceeded the estimated fair value of the net tangible assets acquired by approximately $487 million, of which $393 million was allocated to identified intangible assets and approximately $143 million was included in goodwill in the Company's consolidated balance sheet as of September 24, 2022. The financial results of Green Garden Products have been included in the results of operations within the Garden segment since the date of acquisition. The following table summarizes the purchase price and recording of fair values of the assets acquired and liabilities assumed as of the acquisition date and subsequent adjustments.
| Amounts Previously Recognized as of Acquisition Date (1) | Measurement Period Adjustments | Amounts Recognized as of Acquisition Date (as Adjusted) | |||||||||||||||
| (in thousands) | |||||||||||||||||
| Current assets, net of cash and cash equivalents acquired | $ | $ | $ | ||||||||||||||
| Fixed assets | |||||||||||||||||
| Goodwill | |||||||||||||||||
| Other intangible assets, net | |||||||||||||||||
| Other assets | ( |
||||||||||||||||
| Operating lease right-of-use assets | |||||||||||||||||
| Current liabilities | ( |
( |
|||||||||||||||
| Long-term lease liabilities | ( |
( |
|||||||||||||||
| Deferred income taxes and other long-term obligations | ( |
( |
( |
||||||||||||||
| Net assets acquired, less cash and cash equivalents | $ | $ | $ | ||||||||||||||
The impact to the consolidated statement of operations associated with the finalization of purchase accounting and true-up of intangible asset amortization for Green Garden Products was immaterial.
F-16
CENTRAL GARDEN & PET COMPANY
NOTES TO CONSOLIDATED FINANCIAL STATEMENTS (Continued)
D&D Commodities Limited
On June 30, 2021, the Company purchased D&D Commodities, Ltd. ("D&D"), a provider of high-quality, premium bird feed, for approximately $88 million in cash and the assumption of approximately $30 million of long-term debt. Subsequent to the acquisition, $30 million of cash was used to eliminate the acquired long-term debt. The purchase price exceeded the estimated fair value of the net tangible assets acquired by approximately $99 million, of which $64 million was allocated to identified intangible assets and approximately $34 million was included in goodwill in the Company's consolidated balance sheet as of September 24, 2022. The financial results of D&D have been included in the results of operations within the Garden segment since the date of acquisition.
| Amounts Previously Recognized as of Acquisition Date (1) | Measurement Period Adjustments | Amounts Recognized as of Acquisition Date (as Adjusted) | |||||||||||||||
| (in thousands) | |||||||||||||||||
| Current assets, net of cash and cash equivalents acquired | $ | $ | $ | ||||||||||||||
| Fixed assets | |||||||||||||||||
| Goodwill | |||||||||||||||||
| Other assets | ( |
||||||||||||||||
| Other intangible assets, net | |||||||||||||||||
| Current liabilities | ( |
( |
|||||||||||||||
| Long-term debt | ( |
( |
|||||||||||||||
| Net assets acquired, less cash and cash equivalents | $ | $ | $ | ||||||||||||||
(1) As previously reported in the Company's Form 10-K for the fiscal year ended September 25, 2021.
The impact to the consolidated statement of operations associated with the finalization of purchase accounting and true-up of intangible asset amortization for D&D was immaterial.
The Company expects all the goodwill from its acquisition of D&D Commodities Limited to be deductible for tax purposes.
Fiscal 2021
DoMyOwn
On December 18, 2020, the Company acquired DoMyOwn, a leading online retailer of professional-grade control products, for approximately $81 million. The purchase price exceeded the estimated fair value of the net tangible assets acquired by approximately $80.4 million, of which $11.9 million was allocated to identified intangible assets and approximately $68.5 million was included in goodwill in the Company’s consolidated balance sheet as of September 25, 2021. Financial results of DoMyOwn have been included in the results of operations within the Garden segment since the date of acquisition. The following table summarizes the purchase price and recording of fair values of the assets acquired and liabilities assumed as of the acquisition date and subsequent adjustments.
(1) As previously reported in the Company's Form 10-Q for the period ended June 26, 2021.
| Amounts Previously Recognized as of Acquisition Date (1) | Measurement Period Adjustments | Amounts Recognized as of Acquisition Date (as Adjusted) | |||||||||||||||
| (in thousands) | |||||||||||||||||
| Current assets, net of cash and cash equivalents acquired | $ | $ | $ | ||||||||||||||
| Fixed assets | |||||||||||||||||
| Goodwill | |||||||||||||||||
| Other assets | ( |
||||||||||||||||
| Other intangible assets, net | |||||||||||||||||
| Current liabilities | ( |
( |
|||||||||||||||
| Net assets acquired, less cash and cash equivalents | $ | $ | $ | ||||||||||||||
F-17
CENTRAL GARDEN & PET COMPANY
NOTES TO CONSOLIDATED FINANCIAL STATEMENTS (Continued)
The impact to the consolidated statement of operations associated with the finalization of purchase accounting and true-up of intangible assets for DoMyOwn was immaterial.
Hopewell Nursery
On December 31, 2020, the Company purchased substantially all of the assets of Hopewell Nursery, a leading live goods wholesale grower serving retail nurseries, landscape contractors, wholesalers and garden centers across the Northeast, for approximately $81 million. The purchase price exceeded the estimated fair value of the net tangible assets acquired by approximately $15 million, of which approximately $4.1 million was allocated to identified intangible assets and approximately $10.9 million was included in goodwill in the Company's consolidated balance sheet as of September 25, 2021. Financial results of Hopewell Nursery have been included in the results of operations within the Garden segment since the date of acquisition. The following table summarizes the purchase price and recording of fair values of the assets acquired and liabilities assumed as of the acquisition date and subsequent adjustments.
(1) As previously reported in the Company's Form 10-Q for the period ended June 26, 2021.
| Amounts Previously Recognized as of Acquisition Date (1) | Measurement Period Adjustments | Amounts Recognized as of Acquisition Date (as Adjusted) | |||||||||||||||
| (in thousands) | |||||||||||||||||
| Current assets, net of cash and cash equivalents acquired | $ | $ | $ | ||||||||||||||
| Fixed assets | ( |
||||||||||||||||
| Goodwill | |||||||||||||||||
| Other assets | ( |
||||||||||||||||
| Other intangible assets, net | |||||||||||||||||
| Current liabilities | ( |
( |
|||||||||||||||
| Other long-term liabilities | ( |
( |
|||||||||||||||
| Net assets acquired, less cash and cash equivalents | $ | $ | $ | ||||||||||||||
The impact to the statement of operations associated with the finalization of purchase accounting and true-up of intangible assets for Hopewell Nursery was immaterial.
Proforma financial information has not been presented as the DoMyOwn and Hopewell Nursery acquisitions were not considered material to the Company's overall consolidated financial statements during the periods presented.
The Company expects all the goodwill from both of the acquisitions above to be deductible for tax purposes.
Green Garden Products
The finalization of the allocation of the purchase price to the fair value of the tangible assets, intangible assets and liabilities acquired was finalized in the second quarter of fiscal 2022.
For the fiscal year ended September 25, 2021, net sales and net income related to Green Garden Products were approximately $122.4 million and $1.6 million, respectively.
The following unaudited pro forma financial information summarizes the combined results of operations for Central and Green Garden Products as if the companies were combined as of the beginning of fiscal 2020.
| Fiscal Year Ended | ||||||||||||||
| September 25, 2021 | September 26, 2020 | |||||||||||||
| in thousands except per share amounts | ||||||||||||||
| Net sales | $ | $ | ||||||||||||
| Net income attributable to Central Garden & Pet Company | $ | $ | ||||||||||||
| Diluted net income per share attributable to Central Garden & Pet Company | $ | $ | ||||||||||||
F-18
CENTRAL GARDEN & PET COMPANY
NOTES TO CONSOLIDATED FINANCIAL STATEMENTS (Continued)
This pro forma information is based on historical results of operations, adjusted for the preliminary estimated allocation of the purchase price and other acquisition adjustments. This pro forma information is not necessarily indicative of what the results of the Company would have been had it operated the business since the beginning of the periods presented. The pro forma adjustments reflect the income statement effects of the elimination of intercompany sales and profit, amortization of intangible assets related to the fair value adjustments of the assets acquired, elimination of interest expense on Green Garden Products debt that was paid off at the time of acquisition, incremental interest expense directly resulting from the acquisition and the related tax effects.
D&D Commodities Limited
The finalization of the allocation of the purchase price to the fair value of the tangible assets, intangible assets and liabilities acquired was finalized in the fourth quarter of fiscal 2022.
The Company includes the unallocated purchase price for acquisitions in other assets on its consolidated balance sheet.
Divestiture
Breeder's Choice
In December 2020, the Company completed the sale of certain assets of its Breeder's Choice business unit. Prior to the sale of Breeder's Choice assets, the Company recognized the financial results of the business unit in its Pet segment. The Company received cash proceeds of $2.4 million and sold approximately $4.7 million of current and long-term net assets. The Company recognized a loss on the sale of the Breeder's Choice business unit of approximately $2.6 million during the three months ended December 26, 2020 as part of selling, general and administrative expenses in the Company's condensed consolidated statement of operations.
Fiscal 2020
The Company did no t make any acquisitions in fiscal 2020.
Investments
4. Concentration of Credit Risk and Significant Customers and Suppliers
F-19
CENTRAL GARDEN & PET COMPANY
NOTES TO CONSOLIDATED FINANCIAL STATEMENTS (Continued)
5. Allowance for Credit Losses and Customer Allowances
The Company’s trade accounts receivable are recorded at net realizable value, which includes an allowance for estimated credit losses, as well as allowances for contractual customer deductions accounted for as variable consideration as described in Note 1 - Organization and Significant Accounting Policies. Under the guidance found in ASC Topic 326, the “expected credit loss” model replaces the previous incurred loss model and requires consideration of a broader range of information to estimate expected credit losses over the lives of the Company’s trade accounts receivable. The Company’s prior methodology for estimating credit losses on its trade accounts receivable did not differ significantly from the new requirements of Topic 326.
The Company maintains an allowance for credit losses related to its trade accounts receivable for future expected credit losses resulting from the inability of its customers to make required payments. The Company estimates the allowance based upon historical bad debts, current customer receivable balances and the customer’s financial condition. The allowance is adjusted to reflect differences in current conditions as well as changes in forecasted macroeconomic conditions. The Company’s estimate of credit losses includes expected current and future economic and market conditions surrounding the COVID-19 pandemic, which did not significantly impact its allowance.
| Description | Balances at Beginning of Period |
Charged/ (Credited) to Costs and Expenses |
Asset Write-Offs, Less Recoveries |
Balances at End of Period |
||||||||||||||||||||||
| (in thousands) | ||||||||||||||||||||||||||
| Fiscal Year Ended September 26, 2020 | ( |
|||||||||||||||||||||||||
| Fiscal Year Ended September 25, 2021 | ( |
|||||||||||||||||||||||||
| Fiscal Year Ended September 24, 2022 | ( |
|||||||||||||||||||||||||
6. Inventories, net
| September 24, 2022 | September 25, 2021 | ||||||||||
| (in thousands) | |||||||||||
| Raw materials | $ | $ | |||||||||
| Work in progress | |||||||||||
| Finished goods | |||||||||||
| Supplies | |||||||||||
| Total inventories, net | $ | $ | |||||||||
F-20
CENTRAL GARDEN & PET COMPANY
NOTES TO CONSOLIDATED FINANCIAL STATEMENTS (Continued)
7. Property and Equipment, Net
| September 24, 2022 | September 25, 2021 | |||||||||||||
| (in thousands) | ||||||||||||||
| Land | $ | $ | ||||||||||||
| Buildings and improvements | ||||||||||||||
| Transportation equipment | ||||||||||||||
| Machine and warehouse equipment | ||||||||||||||
| Capitalized software | ||||||||||||||
| Office furniture and equipment | ||||||||||||||
| Assets under construction | ||||||||||||||
| Accumulated depreciation and amortization | ( |
( |
||||||||||||
| $ | $ | |||||||||||||
Depreciation and amortization expense, including the amortization of intangible assets, charged to operations was $80.9 million, $74.7 million and $55.4 million for fiscal 2022, 2021 and 2020, respectively.
8. Goodwill
|
Garden Products
Segment
|
Pet Products Segment |
Total | |||||||||||||||
| (in thousands) | |||||||||||||||||
| Balance as of September 28, 2019 | |||||||||||||||||
| Goodwill | $ | $ | $ | ||||||||||||||
| Accumulated impairment losses | ( |
( |
( |
||||||||||||||
| Additions in fiscal 2020 | |||||||||||||||||
| Balance as of September 26, 2020 | |||||||||||||||||
| Goodwill | |||||||||||||||||
| Accumulated impairment losses | ( |
( |
( |
||||||||||||||
| Additions in fiscal 2021 | |||||||||||||||||
| Balance as of September 25, 2021 | |||||||||||||||||
| Goodwill | |||||||||||||||||
| Accumulated impairment losses | ( |
( |
( |
||||||||||||||
| Additions in fiscal 2022 | |||||||||||||||||
| Balance as of September 24, 2022 | |||||||||||||||||
| Goodwill | |||||||||||||||||
| Accumulated impairment losses | ( |
( |
( |
||||||||||||||
| $ | $ | $ | |||||||||||||||
Additions or reductions to goodwill include acquisitions, sale of businesses, purchase price adjustments and adjustments of amounts upon finalization of purchase accounting.
The Company tests goodwill for impairment annually (as of the first day of the fourth fiscal quarter), or whenever events occur or circumstances change that would more likely than not reduce the fair value of a reporting unit below its carrying amount, by first assessing qualitative factors to determine whether it is more likely than not the fair value of the reporting unit is less than its carrying amount. The
F-21
CENTRAL GARDEN & PET COMPANY
NOTES TO CONSOLIDATED FINANCIAL STATEMENTS (Continued)
qualitative assessment evaluates factors including macro-economic conditions, industry-specific and company-specific considerations, legal and regulatory environments and historical performance. If it is determined that it is more likely than not the fair value of the reporting unit is greater than its carrying amount, it is unnecessary to perform the quantitative goodwill impairment test. If it is determined that it is more likely than not that the fair value of the reporting unit is less than its carrying amount, the quantitative test is performed to identify potential goodwill impairment. Based on certain circumstances, the Company may elect to bypass the qualitative assessment and proceed directly to performing the quantitative goodwill impairment test, which compares the estimated fair value of our reporting units to their related carrying values, including goodwill. Impairment is indicated if the estimated fair value of the reporting unit is less than its carrying value, and an impairment charge is recognized for the differential. The Company’s goodwill impairment analysis also includes a comparison of the aggregate estimated fair value of its two reporting units to the Company’s total market capitalization.
Determining the fair value of a reporting unit involves the use of significant estimates and assumptions. The estimate of fair value of each of the Company’s reporting units is based on the Company’s projection of revenues, gross margin, operating costs and cash flows considering historical and estimated future results, general economic and market conditions as well as the impact of planned business and operational strategies. The Company bases its fair value estimates on assumptions the Company believes to be reasonable at the time, but such assumptions are subject to inherent uncertainty. Assumptions critical to the Company’s fair value estimates were: (i) discount rates used in determining the fair value of the reporting units; (ii) estimated future cash flows; and (iii) projected revenue and operating profit growth rates used in the reporting unit models. Actual results may differ from those estimates. The valuations employ present value techniques to measure fair value and consider market factors.
In connection with the Company’s annual goodwill impairment testing performed during fiscal 2022 and 2021, the Company made a qualitative evaluation about the likelihood of goodwill impairment to determine whether it was necessary to calculate the fair values of its reporting units under the goodwill impairment test. The Company completed its qualitative assessment of potential goodwill impairment in each fiscal year, and it was determined that it was more likely than not the fair values of the Company's reporting units were greater than their carrying amounts in each fiscal year, and accordingly, no further testing of goodwill was required in fiscal 2022 and 2021.
F-22
CENTRAL GARDEN & PET COMPANY
NOTES TO CONSOLIDATED FINANCIAL STATEMENTS (Continued)
9. Other Intangible Assets
| Gross | Accumulated Amortization |
Accumulated Impairment |
Net Carrying Value |
||||||||||||||||||||
| (in millions) | |||||||||||||||||||||||
| September 24, 2022 | |||||||||||||||||||||||
| Marketing-related intangible assets – amortizable | $ | $ | ( |
$ | $ | ||||||||||||||||||
| Marketing-related intangible assets – nonamortizable | ( |
||||||||||||||||||||||
| Total | ( |
( |
|||||||||||||||||||||
| Customer-related intangible assets – amortizable | ( |
( |
|||||||||||||||||||||
| Other acquired intangible assets – amortizable | ( |
||||||||||||||||||||||
| Other acquired intangible assets – nonamortizable | ( |
||||||||||||||||||||||
| Total | ( |
( |
|||||||||||||||||||||
| Total other intangible assets | $ | $ | ( |
$ | ( |
$ | |||||||||||||||||
| September 25, 2021 | |||||||||||||||||||||||
| Marketing-related intangible assets – amortizable | $ | $ | ( |
$ | $ | ||||||||||||||||||
| Marketing-related intangible assets – nonamortizable | ( |
||||||||||||||||||||||
| Total | ( |
( |
|||||||||||||||||||||
| Customer-related intangible assets – amortizable | ( |
( |
|||||||||||||||||||||
| Other acquired intangible assets – amortizable | ( |
||||||||||||||||||||||
| Other acquired intangible assets – nonamortizable | ( |
||||||||||||||||||||||
| Total | ( |
( |
|||||||||||||||||||||
| Total other intangible assets | $ | $ | ( |
$ | ( |
$ | |||||||||||||||||
| September 26, 2020 | |||||||||||||||||||||||
| Marketing-related intangible assets – amortizable | $ | $ | ( |
$ | $ | ||||||||||||||||||
| Marketing-related intangible assets – nonamortizable | ( |
||||||||||||||||||||||
| Total | ( |
( |
|||||||||||||||||||||
| Customer-related intangible assets – amortizable | ( |
( |
|||||||||||||||||||||
| Other acquired intangible assets – amortizable | ( |
||||||||||||||||||||||
| Other acquired intangible assets – nonamortizable | ( |
||||||||||||||||||||||
| Total | ( |
( |
|||||||||||||||||||||
| Total other intangible assets | $ | $ | ( |
$ | ( |
$ | |||||||||||||||||
Other acquired intangible assets include contract-based and technology-based intangible assets.
As part of its acquisition of DoMyOwn in the first quarter of fiscal 2021 and Hopewell Nursery in the second quarter of fiscal 2021, the Company acquired approximately $1.5 million of marketing related intangible assets, $3.3 million of customer related intangible assets and $11.2 million of other intangible assets. As part of its acquisition of Green Garden Products in the second quarter of fiscal 2021 and D&D Commodities in the fourth quarter of fiscal 2021, the Company acquired $181.9 million of marketing related intangible assets, $272.8 million of customer related intangible assets and $2.5 million of other intangible assets. The allocation of the purchase price to the acquired intangible assets of Green Garden Products and D&D Commodities was finalized during fiscal 2022. See Note 3 – Acquisitions.
The Company evaluates long-lived assets, including amortizable and indefinite-lived intangible assets, for impairment whenever events or changes in circumstances indicate the carrying value may not be recoverable. The Company evaluates indefinite-lived intangible assets on an annual basis. Factors indicating the carrying value of the Company's amortizable intangible assets may not be recoverable were not present in fiscal 2020, 2021 or 2022, and accordingly, no impairment testing was performed on these assets.
The Company is currently amortizing its acquired intangible assets with definite lives over periods ranging from two years to 25 years; over weighted-average remaining lives of two years for marketing-related intangibles, twelve years for customer-related intangibles and six
F-23
CENTRAL GARDEN & PET COMPANY
NOTES TO CONSOLIDATED FINANCIAL STATEMENTS (Continued)
F-24
CENTRAL GARDEN & PET COMPANY
NOTES TO CONSOLIDATED FINANCIAL STATEMENTS (Continued)
10. Leases
The Company has operating and finance leases for manufacturing and distribution facilities, vehicles, equipment and office space. The Company's leases have remaining lease terms of to 12 years, inclusive of renewal or termination options that the Company is reasonably certain to exercise. The Company does not include significant restrictions or covenants in its lease agreements, and residual value guarantees are not included within its operating leases. Some of the Company's leasing arrangements require variable payments that are dependent on usage or output or may vary for other reasons, such as product costs, insurance and tax payments. These variable payments are not included in the Company's recorded lease assets and liabilities and are expensed as incurred. Certain leases are tied to a variable index or rate and are included in lease assets and liabilities based on the indices or rates as of lease commencement. See Note 1 – Organization and Significant Accounting Policies, for more information about the Company's lease accounting policies.
| Balance Sheet Classification | September 24, 2022 | September 25, 2021 | |||||||||||||||
| (in millions) | |||||||||||||||||
| Operating leases | |||||||||||||||||
| Right-of-use assets | Operating lease right-of-use assets | $ | $ | ||||||||||||||
| Current lease liabilities | Current operating lease liabilities | $ | $ | ||||||||||||||
| Non-current lease liabilities | Long-term operating lease liabilities | ||||||||||||||||
| Total operating lease liabilities | $ | $ | |||||||||||||||
| Finance leases | |||||||||||||||||
| Right-of-use assets | $ | $ | |||||||||||||||
| Current lease liabilities | $ | $ | |||||||||||||||
| Non-current lease liabilities | |||||||||||||||||
| Total finance lease liabilities | $ | $ | |||||||||||||||
| Fiscal Year Ended | ||||||||||||||
| September 24, 2022 | September 25, 2021 | |||||||||||||
| (in millions) | ||||||||||||||
| Operating lease cost | $ | $ | ||||||||||||
| Finance lease cost: | ||||||||||||||
| Amortization of right-of-use assets | ||||||||||||||
| Interest on lease liabilities | ||||||||||||||
| Total finance lease cost | $ | $ | ||||||||||||
| Short-term lease cost | ||||||||||||||
| Variable lease cost | ||||||||||||||
| Total lease cost | $ | $ | ||||||||||||
F-25
CENTRAL GARDEN & PET COMPANY
NOTES TO CONSOLIDATED FINANCIAL STATEMENTS (Continued)
| Fiscal Year Ended | |||||||||||||||||
| September 24, 2022 | September 25, 2021 | ||||||||||||||||
| (in millions) | |||||||||||||||||
| Cash paid for amounts included in the measurement of lease liabilities: | |||||||||||||||||
| Operating cash flows from operating leases | $ | $ | |||||||||||||||
| Operating cash flows from finance leases | $ | $ | |||||||||||||||
| Financing cash flows from finance leases | $ | $ | |||||||||||||||
| Right-of-use assets obtained in exchange for lease obligations: | |||||||||||||||||
| Operating leases | $ | $ | |||||||||||||||
| Finance leases | $ | $ | |||||||||||||||
| September 24, 2022 | September 25, 2021 | |||||||||||||
| Weighted-average remaining lease term (in years): | ||||||||||||||
| Operating leases | ||||||||||||||
| Finance leases | ||||||||||||||
| Weighted-average discount rate: | ||||||||||||||
| Operating leases | % | % | ||||||||||||
| Finance leases | % | % | ||||||||||||
| September 24, 2022 | ||||||||||||||
| Operating Leases | Finance Leases | |||||||||||||
| Fiscal Year | (in millions) | |||||||||||||
| 2023 | $ | $ | ||||||||||||
| 2024 | ||||||||||||||
| 2025 | ||||||||||||||
| 2026 | ||||||||||||||
| 2027 | ||||||||||||||
| Thereafter | ||||||||||||||
| Total future undiscounted lease payments | $ | $ | ||||||||||||
| Less imputed interest | ( |
|||||||||||||
| Total reported lease liability | $ | $ | ||||||||||||
F-26
CENTRAL GARDEN & PET COMPANY
NOTES TO CONSOLIDATED FINANCIAL STATEMENTS (Continued)
11. Long-Term Debt
| September 24, 2022 | September 25, 2021 | ||||||||||||||||
| (in thousands) | |||||||||||||||||
Senior notes, interest at |
|||||||||||||||||
Senior notes, interest at |
|||||||||||||||||
Senior notes, interest at |
|||||||||||||||||
| Unamortized debt issuance costs | ( |
( |
|||||||||||||||
| Net carrying value | |||||||||||||||||
Asset-based revolving credit facility, interest at LIBOR plus a margin of |
|||||||||||||||||
| Other notes payable | |||||||||||||||||
| Total | |||||||||||||||||
| Less current portion | ( |
( |
|||||||||||||||
| Long-term portion | $ | $ | |||||||||||||||
Senior Notes
Issuance of $400 million 4.125 % Senior Notes due 2031
On April 30, 2021, the Company issued $400 million aggregate principal amount of 4.125 % senior notes due April 2031 (the "2031 Notes"). The Company used a portion of the net proceeds from the offering to repay all outstanding borrowings under its Amended Credit Facility, with the remainder used for general corporate purposes.
The Company incurred approximately $6 million of debt issuance costs in conjunction with this issuance, which included underwriter fees and legal, accounting and rating agency expenses. The debt issuance costs are being amortized over the term of the 2031 Notes.
The 2031 Notes require semi-annual interest payments on April 30 and October 30. The 2031 Notes are unconditionally guaranteed on a senior basis by each of the Company's existing and future domestic restricted subsidiaries which are borrowers under or guarantors of Central's Amended Credit Facility. The 2031 Notes were issued in a private placement under Rule 144A and will not be registered under the Securities Act of 1933.
The Company may redeem some or all of the 2031 Notes at anytime, at its option, prior to April 26, 2026 at the principal amount plus a "make whole" premium. At any time prior to April 30, 2024, the Company may also redeem, at its option, up to 40 % of the notes with the proceeds of certain equity offerings at a redemption price of 104.125 % of the principal amount of the notes. The Company may redeem some or all of the 2031 Notes at the Company’s option, at any time on or after April 30, 2026 for 102.063 %, on or after April 30, 2027 for 101.375 %, on or after April 30, 2028 for 100.688 % and on or after April 30, 2029 for 100.0 %, plus accrued and unpaid interest.
The holders of the 2031 Notes have the right to require the Company to repurchase all or a portion of the 2031 Notes at a purchase price equal to 101 % of the principal amount of the notes repurchased, plus accrued and unpaid interest, upon the occurrence of specific kinds of changes of control.
The 2031 Notes contain customary high yield covenants, including covenants limiting debt incurrence and restricted payments, subject to certain baskets and exceptions. The Company was in compliance with all financial covenants as of September 24, 2022.
Issuance of $500 million 4.125 % Senior Notes due 2030
On October 16, 2020, the Company issued $500 million aggregate principal amount of 4.125 % senior notes due October 2030 (the "2030 Notes"). In November 2020, the Company used a portion of the net proceeds to redeem all of its outstanding 6.125 % senior notes due November 2023 (the "2023 Notes") at a redemption price of 101.531 % plus accrued and unpaid interest, and to pay related fees and expenses, with the remainder used for general corporate purposes.
The Company incurred approximately $8.0 million of debt issuance costs associated with this transaction, which included underwriter fees and legal, accounting and rating agency expenses. The debt issuance costs are being amortized over the term of the 2030 Notes.
F-27
CENTRAL GARDEN & PET COMPANY
NOTES TO CONSOLIDATED FINANCIAL STATEMENTS (Continued)
As a result of the Company's redemption of the 2023 Notes, the Company incurred a call premium payment of $6.1 million, overlapping interest expense for 30 days of approximately $1.4 million and a $2.5 million non-cash charge for the write-off of unamortized deferred financing costs related to the 2023 Notes. These amounts are included in interest expense in the consolidated statements of operations.
The 2030 Notes require semiannual interest payments on October 15 and April 15. The 2030 Notes are unconditionally guaranteed on a senior basis by each of the Company's existing and future domestic restricted subsidiaries which are borrowers under or guarantors of Central's senior secured revolving credit facility or guarantee Central's other debt.
The Company may redeem some or all of the 2030 Notes at anytime, at its option, prior to October 15, 2025 at a price equal to 100 % of the principal amount plus a “make-whole” premium. Prior to October 15, 2023, the Company may redeem up to 40 % of the original aggregate principal amount of the notes with the proceeds of certain equity offerings at a redemption price of 104.125 % of the principal amount of the notes. The Company may redeem some or all of the 2030 Notes, at its option, in whole or in part, at any time on or after October 15, 2025 for 102.063 %, on or after October 15, 2026 for 101.375 %, on or after October 15, 2027 for 100.688 % and on or after October 15, 2028 for 100.0 %, plus accrued and unpaid interest.
The holders of the 2030 Notes have the right to require the Company to repurchase all or a portion of the 2030 Notes at a purchase price equal to 101.0 % of the principal amount of the notes repurchased, plus accrued and unpaid interest upon the occurrence of a change of control.
The 2030 Notes contain customary high yield covenants, including covenants limiting debt incurrence and restricted payments, subject to certain baskets and exceptions. The Company was in compliance with all financial covenants as of September 24, 2022.
$300 million 5.125 % Senior Notes due 2028
On December 14, 2017, the Company issued $300 million aggregate principal amount of 5.125 % senior notes due February 2028 (the "2028 Notes"). The Company used the net proceeds from the offering to finance acquisitions and for general corporate purposes.
The Company incurred approximately $4.8 million of debt issuance costs in conjunction with this transaction, which included underwriter fees and legal, accounting and rating agency expenses. The debt issuance costs are being amortized over the term of the 2028 Notes.
The 2028 Notes require semiannual interest payments on February 1 and August 1. The 2028 Notes are unconditionally guaranteed on a senior basis by the Company's existing and future domestic restricted subsidiaries who are borrowers under or guarantors of Central's senior secured revolving credit facility or who guarantee the 2023 Notes.
The Company may redeem some or all of the 2028 Notes at anytime, at its option, prior to January 1, 2023 at the principal amount plus a “make whole” premium. The Company may redeem some or all of the 2028 Notes, at its option, at any time on or after January 1, 2023 for 102.563 %, on or after January 1, 2024 for 101.708 %, on or after January 1, 2025 for 100.854 %, and on or after January 1, 2026 for 100.0 %, plus accrued and unpaid interest.
The holders of the 2028 Notes have the right to require us to repurchase all or a portion of the 2028 Notes at a purchase price equal to 101.0 % of the principal amount of the notes repurchased, plus accrued and unpaid interest upon the occurrence of a change of control.
The 2028 Notes contain customary high yield covenants, including covenants limiting debt incurrence and restricted payments, subject to certain baskets and exceptions. The Company was in compliance with all financial covenants as of September 24, 2022.
Asset-Based Loan Facility Amendment
On December 16, 2021, the Company entered into a Third Amended and Restated Credit Agreement (“Amended Credit Agreement”). The Amended Credit Agreement amended and restated the previous credit agreement dated September 27, 2019 (the "Predecessor Credit Agreement"), and provides for a $750 million principal amount senior secured asset-based revolving credit facility, with up to an additional $400 million principal amount available with the consent of the Lenders, as defined, if the Company exercises the uncommitted accordion feature set forth therein (collectively, the “Amended Credit Facility”). The Amended Credit Facility matures on December 16, 2026. The Company may borrow, repay and reborrow amounts under the Amended Credit Facility until its maturity date, at which time all amounts outstanding under the Amended Credit Facility must be repaid in full.
The Amended Credit Facility is subject to a borrowing base that is calculated using a formula based upon eligible receivables and inventory, and at the Company's election, eligible real property, minus certain reserves. The Company did not draw down any commitments under the Amended Credit Facility upon closing. Proceeds of the Amended Credit Facility will be used for general corporate purposes. Net availability under the Amended Credit Facility was approximately $517 million as of September 24, 2022. The Amended Credit Facility includes a $50 million sublimit for the issuance of standby letters of credit and a $75 million sublimit for short-notice borrowings. As of
F-28
CENTRAL GARDEN & PET COMPANY
NOTES TO CONSOLIDATED FINANCIAL STATEMENTS (Continued)
September 24, 2022, there were no borrowings outstanding and no letters of credit outstanding under the Amended Credit Facility. Outside of the Amended Credit Facility, there were other letters of credit of $1.3 million outstanding as of September 24, 2022.
Borrowings under the Amended Credit Facility will bear interest at an index based on LIBOR (which will not be less than 0.00 %) or, at the option of the Company, the Base Rate, plus, in either case, an applicable margin based on the Company's usage under the credit facility. Base Rate is defined as the highest of (a) the Truist prime rate, (b) the Federal Funds Rate plus 0.50 %, (c) one-month LIBOR plus 1.00 % and (d) 0.00 %. The applicable margin for LIBOR-based borrowings fluctuates between 1.00 %-1.50 %, and was 1.0 % as of September 24, 2022, and the applicable margin for Base Rate borrowings fluctuates between 0.00 %-0.50 %, and was 0.00 % as of September 24, 2022. An unused line fee shall be payable quarterly in respect of the total amount of the unutilized Lenders’ commitments and short-notice borrowings under the Amended Credit Facility. Letter of credit fees at the applicable margin on the average undrawn and unreimbursed amount of letters of credit shall be payable quarterly and a facing fee of 0.125 % shall be payable quarterly for the stated amount of each letter of credit. The Company is also required to pay certain fees to the administrative agent under the Amended Credit Facility. The Amended Credit Facility provides for the transition from LIBOR to Secured Overnight Financing Rate ("SOFR") and does not require an amendment in connection with such transition. As of September 24, 2022, the applicable interest rate related to Base Rate borrowings was 6.3 %, and the applicable interest rate related to one-month LIBOR-based borrowings was 4.1 %.
The Company incurred approximately $2.4 million of debt issuance costs in conjunction with this transaction, which included lender fees and legal expenses. The debt issuance costs are being amortized over the term of the Amended Credit Facility.
The Amended Credit Facility continues to contain customary covenants, including financial covenants which require the Company to maintain a minimum fixed charge coverage ratio of 1 :1 upon triggered quarterly testing (e.g. when availability falls below certain thresholds established in the agreement), reporting requirements and events of default. The Amended Credit Facility is secured by substantially all assets of the borrowing parties, including (i) pledges of 100 % of the stock or other equity interest of each domestic subsidiary that is directly owned by such entity and (ii) 65 % of the stock or other equity interest of each foreign subsidiary that is directly owned by such entity, in each case subject to customary exceptions. The Company was in compliance with all financial covenants under the Amended Credit Facility as of September 24, 2022.
The scheduled principal repayments on long-term debt as of September 24, 2022 are as follows:
| (in thousands) | ||||||||
| Fiscal year: | ||||||||
| 2023 | $ | |||||||
| 2024 | ||||||||
| 2025 | ||||||||
| 2026 | ||||||||
| 2027 | ||||||||
| Thereafter | ||||||||
| Total | $ | (1) |
||||||
(1)Debt repayments do not reflect the unamortized portion of deferred financing costs associated with the 2028 Notes, 2030 Notes and 2031 Notes of approximately $14.1 million as of September 24, 2022, of which, $2.5 million is amortizable until February 2028, $6.4 million is amortizable until October 2030 and $5.2 million is amortizable until April 2031, and is included in the carrying value.
12. Commitments and Contingencies
Commitments
Letters of credit – The Company had $1.3 million of outstanding letters of credit related to normal business transactions at September 24, 2022. These agreements require the Company to maintain specified amounts of cash as collateral in segregated accounts to support the letters of credit issued thereunder, which will affect the amount of cash the Company has available for other uses. The amount of cash collateral in these segregated accounts was $14.7 million and $13.1 million as of September 24, 2022 and September 25, 2021, respectively, and is reflected in “Restricted cash” on the Company's consolidated balance sheets.
Purchase commitments – Production and purchase agreements (primarily for grass seed and grains) entered into in the ordinary course of business may obligate the Company to make future purchases based on estimated yields. The terms of these contracts vary; some have fixed prices or quantities while others have variable pricing and quantities. For certain agreements, management estimates are used to develop the quantities and pricing for anticipated purchases, and future purchases could vary significantly from such estimates.
F-29
CENTRAL GARDEN & PET COMPANY
NOTES TO CONSOLIDATED FINANCIAL STATEMENTS (Continued)
Contingencies
The Company may from time to time become involved in legal proceedings in the ordinary course of business. Currently, the Company is not a party to any legal proceedings the resolution of which management believes could have a material effect on the Company’s financial position or results of operations with the exception of the proceeding below.
In 2012, Nite Glow Industries, Inc and its owner, Marni Markell, (“Nite Glow”) filed suit in the U.S. District Court for New Jersey against the Company alleging that the applicator developed and used by the Company for certain of its branded topical flea and tick products infringes a patent held by Nite Glow and asserted related claims for breach of contract and misappropriation of confidential information based on the terms of a Non-Disclosure Agreement. On June 27, 2018, a jury returned a verdict in favor of Nite Glow on each of the three claims and awarded damages of approximately $12.6 million. The court ruled on post-trial motions in early June 2020, reducing the judgment amount to $12.4 million and denying the plaintiff's request for attorneys' fees. The Company filed its notice of appeal and the plaintiffs cross-appealed. On July 14, 2021, the Federal Circuit Court of Appeals issued its decision on the appeal. The Federal Circuit concluded that the Company did not infringe plaintiff's patent and determined that the breach of contract claim raised no non-duplicative damages and should be dismissed. The court affirmed the jury's liability verdict on the misappropriation of confidential information claim but ordered a new trial on damages on that single claim limited to the "head start" benefit, if any, generated by the confidential information. The Company intends to vigorously pursue its defenses in the future proceedings and believes that it will prevail on the merits as to the head start damages issue. While the Company believes that the ultimate resolution of this matter will not have a material impact on the Company's consolidated financial statements, the outcome of litigation is inherently uncertain and the final resolution of this matter may result in expense to the Company in excess of management's expectations.
During fiscal 2013, the Company received notices from several states stating that they have appointed an agent to conduct an examination of the books and records of the Company to determine whether it has complied with state unclaimed property laws. In addition to seeking unclaimed property subject to escheat laws, the states may seek interest, penalties and other relief. The examinations are continuing, and the ultimate resolution and impact on the Company's consolidated financial statements is uncertain.
The Company has experienced, and may in the future experience, issues with products that may lead to product liability, recalls, withdrawals, replacements of products, or regulatory actions by governmental authorities. The Company has not experienced recent issues with products, the resolution of which management believes would have a material effect on the Company’s financial position or results of operations.
F-30
CENTRAL GARDEN & PET COMPANY
NOTES TO CONSOLIDATED FINANCIAL STATEMENTS (Continued)
13. Income Taxes
| Fiscal Year Ended | |||||||||||||||||
| September 24, 2022 | September 25, 2021 | September 26, 2020 | |||||||||||||||
| (in thousands) | |||||||||||||||||
| Current: | |||||||||||||||||
| Federal | $ | $ | $ | ||||||||||||||
| State | |||||||||||||||||
| Foreign | ( |
||||||||||||||||
| Total | |||||||||||||||||
| Deferred: | |||||||||||||||||
| Federal | ( |
( |
|||||||||||||||
| State | ( |
( |
|||||||||||||||
| Foreign | ( |
( |
|||||||||||||||
| Total | ( |
( |
|||||||||||||||
| Total | $ | $ | $ | ||||||||||||||
F-31
CENTRAL GARDEN & PET COMPANY
NOTES TO CONSOLIDATED FINANCIAL STATEMENTS (Continued)
| Fiscal Year Ended | |||||||||||||||||
| September 24, 2022 | September 25, 2021 | September 26, 2020 | |||||||||||||||
| Statutory federal income tax rate | % | % | % | ||||||||||||||
| State income taxes, net of federal benefit | |||||||||||||||||
| Other permanent differences | |||||||||||||||||
| Adjustment of prior year accruals | ( |
( |
|||||||||||||||
| Credits | ( |
( |
( |
||||||||||||||
| Stock based compensation | ( |
( |
( |
||||||||||||||
| Other | ( |
||||||||||||||||
| Effective income tax rate | % | % | % | ||||||||||||||
| September 24, 2022 | September 25, 2021 | ||||||||||||||||||||||
| Deferred Tax Assets |
Deferred Tax Liabilities |
Deferred Tax Assets |
Deferred Tax Liabilities |
||||||||||||||||||||
| (in thousands) | |||||||||||||||||||||||
| Allowance for doubtful accounts | $ | $ | — | $ | $ | — | |||||||||||||||||
| Inventory write-downs | — | — | |||||||||||||||||||||
| Prepaid expenses | — | — | |||||||||||||||||||||
| Nondeductible reserves | — | — | |||||||||||||||||||||
| State taxes | — | — | |||||||||||||||||||||
| Employee benefits | — | — | |||||||||||||||||||||
| Depreciation and amortization | — | — | |||||||||||||||||||||
| Equity earnings | — | — | |||||||||||||||||||||
| State net operating loss carryforward | — | — | |||||||||||||||||||||
| Stock based compensation | — | — | |||||||||||||||||||||
| State credits | — | — | |||||||||||||||||||||
| Other | — | — | |||||||||||||||||||||
| Valuation allowance | ( |
— | ( |
— | |||||||||||||||||||
| Total | $ | $ | $ | $ | |||||||||||||||||||
The Company also has state tax net operating losses of $92 million, which expire at various times between 2022 and 2042, and foreign losses of $4.5 million, which do not expire.
The Company has state income tax credits of $3.4 million, which expire at various times beginning in 2022 through 2042. In evaluating the Company’s ability to recover its deferred tax assets, the Company considers all available positive and negative evidence including past operating results, future taxable income, and ongoing prudent and feasible tax planning strategies in assessing the need for a valuation allowance against any deferred tax assets. The Company has determined there will be insufficient future separate state and foreign taxable income for the separate parent company and foreign subsidiaries to realize the deferred tax assets. Therefore, valuation allowances of $6.7 million and $7.0 million (net of federal impact) at September 24, 2022 and September 25, 2021, respectively, have been provided to reduce state deferred tax assets to amounts considered recoverable.
The Company classifies uncertain tax positions as non-current income tax liabilities unless expected to be paid within one year. The Company recognizes interest and/or penalties related to income tax matters as a component of pretax income. As of September 24, 2022 and September 25, 2021, accrued interest was less than $0.1 no
F-32
CENTRAL GARDEN & PET COMPANY
NOTES TO CONSOLIDATED FINANCIAL STATEMENTS (Continued)
| (in thousands) | |||||
| Balance as of September 26, 2020 | $ | ||||
| Increases related to prior year tax positions | |||||
| Increases related to current year tax positions | |||||
| Decreases related to prior year tax positions | |||||
| Settlements | ( |
||||
| Decreases related to lapse of statute of limitations | ( |
||||
| Balance as of September 25, 2021 | $ | ||||
| Increases related to prior year tax positions | |||||
| Increases related to current year tax positions | |||||
| Decreases related to prior year tax positions | |||||
| Settlements | |||||
| Decreases related to lapse of statute of limitations | ( |
||||
| Balance as of September 24, 2022 | $ | ||||
As of September 24, 2022, unrecognized income tax benefits totaled approximately $0.3 million and all of the unrecognized tax benefits would, if recognized, impact the Company’s effective income tax rate.
The Company is principally subject to taxation by the United States and various states within the United States. The Company’s tax filings in major jurisdictions are open to examination by tax authorities by the Internal Revenue Service from fiscal year ended 2019 forward and in various state taxing authorities generally from fiscal year ended 2018 forward.
The Company believes there is a reasonable chance that its unrecognized tax benefits will decrease by less than $0.1 million within the next twelve months.
14. Stock-Based Compensation
The Company’s 2003 Omnibus Equity Incentive Plan (the “2003 Plan”), as amended, allows for the grant of options, restricted stock and certain other specified types of awards to key employees, directors and consultants of the Company. The 2003 Plan is administered by the Compensation Committee of the Board of Directors, which is comprised only of independent directors, and which must approve individual awards to be granted, vesting and exercise of share conditions.
There are a total of 5.8 million shares of Common Stock, 19.7 million shares of Class A Common Stock and 500,000 shares of Preferred Stock authorized under the 2003 Plan. If and when the Company issues any shares of Preferred Stock under the 2003 Plan, it will reduce the amount of Class A Common Stock available for future issuance in an amount equal to the number of shares of Class A Common Stock that are issuable upon conversion of such Preferred Stock.
The Company has a Nonemployee Director Equity Incentive Plan (the “Director Plan”) which provides for the grant of options and restricted stock to nonemployee directors of the Company. The Director Plan, as amended, provides for the granting to each independent director of options to purchase a number of shares equal to $200,000 divided by the fair market value of the Company’s common stock on the date of each annual meeting of stockholders and a number of shares of restricted stock equal to $70,000 divided by such fair market value.
As of September 24, 2022, there were approximately 3.9 no shares of Common Stock and Preferred Stock reserved for outstanding equity awards, and there were approximately 4.6 million shares of Common Stock, 9.5 million shares of Class A Common Stock and 0.5 million shares of Preferred Stock remaining for future awards.
Stock Option Awards
The Company recognized stock-based compensation expense of $25.8 million, $23.1 million, and $19 million for the fiscal years ended September 24, 2022, September 25, 2021 and September 26, 2020, respectively, as a component of selling, general and administrative expenses. Share-based compensation expense in fiscal 2022, 2021 and 2020 consisted of $4.9 million, $5.6 million, and $5.1 million, respectively, for stock options, and $13.7 million, $10.7 million and $7.5 million, respectively, for stock awards. Share-based
F-33
CENTRAL GARDEN & PET COMPANY
NOTES TO CONSOLIDATED FINANCIAL STATEMENTS (Continued)
compensation expense in fiscal 2022, 2021 and 2020 also includes $7.2 million, $6.8 million and $6.4 million, respectively, for the Company’s 401(k) matching contributions.
During fiscal 2022, the Company granted time-based stock options with an exercise price based on the closing fair market value on the date of the grant. The majority of the options granted in fiscal 2022 vest in four annual installments commencing approximately one year from the date of grant and expire approximately six years after the grant date.
The fair value of each option award is estimated on the date of grant using the Black-Scholes option valuation model. Expected stock price volatilities are estimated based on the historical volatility of the Company’s stock price. The expected term of options granted is based on analyses of historical employee termination rates, option exercises and the contractual term of the option. The risk-free rates are based on U.S. Treasury yields, for notes with comparable terms as the option grants, in effect at the time of the grant. For purposes of this valuation model, no dividends have been assumed.
The Company’s calculations were made using the Black-Scholes option pricing model with the following weighted average assumptions: expected life from the date of grant 3.7 31.1 % in fiscal 2022, 32.4 % in fiscal 2021, and 32.6 % in fiscal 2020; risk free interest rates, 1.7 % in fiscal 2022, 0.5 % in fiscal 2021 and 1.4 % in fiscal 2020; and no
|
Number of
Shares
(in thousands)
|
Weighted Average Exercise Price per Share |
Weighted Average Remaining Contractual Life |
Aggregate Intrinsic Value (in thousands) |
||||||||||||||||||||
| Outstanding at September 25, 2021 | $ | $ | |||||||||||||||||||||
| Granted | $ | ||||||||||||||||||||||
| Exercised | ( |
$ | |||||||||||||||||||||
| Canceled or expired | ( |
$ | |||||||||||||||||||||
| Outstanding at September 24, 2022 | $ | $ | |||||||||||||||||||||
| Exercisable at September 26, 2020 | $ | $ | |||||||||||||||||||||
| Exercisable at September 25, 2021 | $ | $ | |||||||||||||||||||||
| Exercisable at September 24, 2022 | $ | $ | |||||||||||||||||||||
| Expected to vest after September 24, 2022 | $ | $ | |||||||||||||||||||||
The prices of options to purchase shares of common stock and Class A common stock outstanding at September 24, 2022, September 25, 2021 and September 26, 2020 were between $21.37 to $51.37 per share, $13.82 to $51.37 per share and $10.63 to $38.10 per share, respectively. The weighted average grant date fair value of options granted during the fiscal years ended September 24, 2022, September 25, 2021 and September 26, 2020 was $10.96 , $10.50 and $7.60 , respectively. The total intrinsic value of options exercised during the fiscal years ended September 24, 2022, September 25, 2021 and September 26, 2020 was $6.1 million, $15.1 million, and $9.9 million, respectively.
As of September 24, 2022, there was $6.4 million of total unrecognized compensation cost related to non-vested stock options, which is expected to be recognized over a remaining weighted-average vesting period of two years .
Restricted Stock Awards
As of both September 24, 2022 and September 25, 2021, there were approximately 1.7 five years from the date of grant.
F-34
CENTRAL GARDEN & PET COMPANY
NOTES TO CONSOLIDATED FINANCIAL STATEMENTS (Continued)
| Number of Shares |
Weighted Average Grant Date Fair Value per Share |
||||||||||
| (in thousands) | |||||||||||
| Nonvested at September 25, 2021 | $ | ||||||||||
| Granted | $ | ||||||||||
| Vested | ( |
$ | |||||||||
| Forfeited | ( |
$ | |||||||||
| Nonvested at September 24, 2022 | $ | ||||||||||
As of September 24, 2022, there was $37.7 million of unrecognized compensation cost related to nonvested restricted stock awards, which is expected to be recognized over a weighted average period of three years .
In fiscal 2022, the Company granted a combination of performance stock units (PSU’s) and restricted stock awards under its long-term incentive program, which replaced the option or restricted stock awards historically granted annually under the Company’s long-term incentive plan. The impact of granting PSU’s during fiscal year 2022 was not material to the Company’s Consolidated Financial Statements.
PSU’s provide the right to receive shares of the Company’s common stock based on the Company’s achievement of certain performance criteria at the end of a four-year measurement period (fiscal 2022-fiscal 2025) and continued employment through the vesting period. The number of shares issued at the end of the performance period may range from 50 % to 225 % of the original target award amount (100 %).
15. Shareholders’ Equity
At September 24, 2022 and September 25, 2021, there were 80,000,000 0.01 11,296,351 and 11,335,658 , respectively, were outstanding, and 100,000,000 0.01 41,336,223 and 42,282,922 , respectively, were outstanding. The preferences and relative rights of the Class A common stock are identical to common stock in all respects, except that the Class A common stock generally has no voting rights unless otherwise required by Delaware law.
There are 3,000,000 0.01 1,612,374 one vote per share and the holders of Class B stock are entitled to the lesser of ten votes per share or 49 % of the total votes cast, (ii) stock dividends on common stock may be paid only in shares of common stock and stock dividends on Class B stock may be paid only in shares of Class B stock and (iii) shares of Class B stock have certain conversion rights and are subject to certain restrictions on ownership and transfer. Each share of Class B stock is convertible into one share of common stock, at the option of the holder. Additional shares of Class B stock may only be issued with majority approval of the holders of the common stock and Class B stock, voting as separate classes.
There are 1,000,000 0.01 none
In August 2019, the Company's Board of Directors authorized a new share repurchase program to purchase up to $100 million of its common stock (the "2019 Repurchase Authorization"). The 2019 Repurchase Authorization has no fixed expiration date and expires when the amount authorized has been used or the Board withdraws its authorization. As of September 24, 2022, the Company had $100 million remaining under its 2019 Repurchase Authorization. During fiscal 2022, the Company repurchased approximately 1.4 million shares of its non-voting common stock (CENTA) on the open market at an aggregate cost of approximately $56.2 million, or $40.79 per share, and approximately 39,000 shares of its voting common stock (CENT) on the open market at an aggregate cost of approximately $1.6 million, or $39.72 per share.
In February 2019, the Board of Directors authorized the Company to make supplemental purchases to minimize dilution resulting from issuances under its equity compensation plans (the "Equity Dilution Authorization"). In addition to the Company's regular share repurchase program, it is permitted to purchase annually a number of shares equal to the number of shares of restricted stock or stock options granted in the prior fiscal year, to the extent not already repurchased, and the current fiscal year. The Equity Dilution Authorization has no fixed expiration date and expires when the Board withdraws its authorization. As of September 24, 2022, the Company had authorization remaining from the fiscal 2022 equity plan activity to repurchase up to 0.1 million shares under its Equity Dilution Authorization.
F-35
CENTRAL GARDEN & PET COMPANY
NOTES TO CONSOLIDATED FINANCIAL STATEMENTS (Continued)
16. Earnings Per Share
| Fiscal Year Ended September 24, 2022 | Fiscal Year Ended September 25, 2021 | Fiscal Year Ended September 26, 2020 | |||||||||||||||||||||||||||||||||||||||||||||||||||
| Net Income |
Shares | Per Share |
Net Income |
Shares | Per Share |
Net Income |
Shares | Per Share |
|||||||||||||||||||||||||||||||||||||||||||||
| (in thousands, except per share amounts) | |||||||||||||||||||||||||||||||||||||||||||||||||||||
| Basic EPS: | |||||||||||||||||||||||||||||||||||||||||||||||||||||
| Net income available to common shareholders | $ | $ | $ | $ | $ | $ | |||||||||||||||||||||||||||||||||||||||||||||||
| Effect of dilutive securities: | |||||||||||||||||||||||||||||||||||||||||||||||||||||
| Options to purchase common stock | ( |
( |
( |
||||||||||||||||||||||||||||||||||||||||||||||||||
| Restricted shares | ( |
( |
( |
||||||||||||||||||||||||||||||||||||||||||||||||||
| Diluted EPS: | |||||||||||||||||||||||||||||||||||||||||||||||||||||
| Net income available to common shareholders | $ | $ | $ | $ | $ | $ | |||||||||||||||||||||||||||||||||||||||||||||||
For fiscal 2022, options to purchase 0.4 million shares were not included in the computation of diluted earnings per share because the option exercise prices were greater than the average market price of the common shares and, therefore, the effect of including these options would be anti-dilutive.
For fiscal 2021, options to purchase 0.2 million shares were not included in the computation of diluted earnings per share because the option exercise prices were greater than the average market price of the common shares and, therefore, the effect of including these options would be anti-dilutive.
For fiscal 2020, options to purchase 1.0 million shares were not included in the computation of diluted earnings per share because the option exercise prices were greater than the average market price of the common shares and, therefore, the effect of including these options would be anti-dilutive.
17. Transactions with Related Parties
18. Business Segment Data
The Company’s chief operating decision-maker is its Chief Executive Officer. Operating segments are managed separately because each segment represents a strategic business that offers different products or services. The Company’s chief operating decision maker evaluates performance based on operating income or loss. The Company’s Corporate division is included in the following presentation since certain expenses of this division are not allocated separately to the two operating segments. Segment assets exclude cash equivalents, short-term investments, goodwill, and deferred taxes.
Management has determined that the Company has two operating segments which are also reportable segments based on the level at which the chief operating decision maker reviews the results of operations to make decisions regarding performance assessment and resource allocation. These operating segments are the Pet segment and the Garden segment. Substantially all of the Company’s assets and operations relate to its business in the United States.
F-36
CENTRAL GARDEN & PET COMPANY
NOTES TO CONSOLIDATED FINANCIAL STATEMENTS (Continued)
The Pet segment consists of Nylabone Products, IMS Trading, Four Paws Products, Central Specialty Pet (Avian and Small Animal, C&S Products and Aquatics), Segrest, K&H Pet Products, Arden, DMC, Life Sciences, Interpet, General Pet and Pet Distribution. These businesses are engaged in the manufacture, purchase, sale and delivery of internally and externally produced pet supplies, animal health and insect controls, aquariums, books, dog treats and food, as well as live fish and small animals principally to independent pet distributors, big-box retailers, regional retailer chains, e-commerce retailers, grocery stores and mass merchants. The Garden segment consists of Grass Seed, Bird Feed, Chemicals and Fertilizers, Excel Marketing, Gulfstream, Hydro-Organics, Pottery (terra-cotta), Cedarworks, Bell Nursery, Hopewell Nursery, DMO, Green Garden, D&D Commodities and Garden Distribution. Products manufactured, designed and sourced, or distributed include products found typically in the lawn and garden sections of mass merchandisers, warehouse-type clubs, home improvement centers and nurseries and include live plants; grass, vegetable, flower and herb seed; wild bird feed, bird houses and other birding accessories; terra-cotta pottery; herbicides, pesticides and insecticides. These products are sold directly to national and regional retail chains, independent garden distributors, online retailers, grocery stores, nurseries and garden supply retailers.
The Corporate division includes expenses associated with corporate functions and projects, certain employee benefits, interest income, interest expense and inter-segment eliminations.
| Category | 2022 | 2021 | 2020 | ||||||||||||||||||||
| (in millions) | |||||||||||||||||||||||
| Other garden products | $ | $ | $ | ||||||||||||||||||||
| Other pet products | |||||||||||||||||||||||
| Other manufacturers' products | |||||||||||||||||||||||
| Dog & cat products | |||||||||||||||||||||||
| Wild bird | (1) | ||||||||||||||||||||||
| Controls & fertilizer products | (1) | (1) | |||||||||||||||||||||
| Total | $ | $ | $ | ||||||||||||||||||||
| (1) The product category was less than 10% of our consolidated net sales in the period. | |||||||||||||||||||||||
See Note 4 – Concentration of Credit Risk and Significant Customers and Suppliers for the Company’s largest customers by segment.
F-37
CENTRAL GARDEN & PET COMPANY
NOTES TO CONSOLIDATED FINANCIAL STATEMENTS (Continued)
Financial information relating to the Company’s business segments for each of the three most recent fiscal years is presented in the table below:
| Fiscal Year Ended | ||||||||||||||||||||
| September 24, 2022 | September 25, 2021 | September 26, 2020 | ||||||||||||||||||
| (in thousands) | ||||||||||||||||||||
| Net sales: | ||||||||||||||||||||
| Pet segment | $ | $ | $ | |||||||||||||||||
| Garden segment | ||||||||||||||||||||
| Total | $ | $ | $ | |||||||||||||||||
| Operating income (loss): | ||||||||||||||||||||
| Pet segment | $ | $ | $ | |||||||||||||||||
| Garden segment | ||||||||||||||||||||
| Corporate | ( |
( |
( |
|||||||||||||||||
| Total | ||||||||||||||||||||
| Interest expense | ( |
( |
( |
|||||||||||||||||
| Interest income | ||||||||||||||||||||
| Other expense, net | ( |
( |
( |
|||||||||||||||||
| Income before income taxes and noncontrolling interest | ||||||||||||||||||||
| Income tax expense | ||||||||||||||||||||
| Net income including noncontrolling interest | ||||||||||||||||||||
| Net income attributable to noncontrolling interest | ||||||||||||||||||||
| Net income attributable to Central Garden & Pet Company | $ | $ | $ | |||||||||||||||||
| Assets: | ||||||||||||||||||||
| Pet segment | $ | $ | $ | |||||||||||||||||
| Garden segment | ||||||||||||||||||||
| Corporate and eliminations | ||||||||||||||||||||
| Total | $ | $ | $ | |||||||||||||||||
| Depreciation and amortization: | ||||||||||||||||||||
| Pet segment | $ | $ | $ | |||||||||||||||||
| Garden segment | ||||||||||||||||||||
| Corporate | ||||||||||||||||||||
| Total | $ | $ | $ | |||||||||||||||||
| Expenditures for long-lived assets: | ||||||||||||||||||||
| Pet segment | $ | $ | $ | |||||||||||||||||
| Garden segment | ||||||||||||||||||||
| Corporate | ||||||||||||||||||||
| Total | $ | $ | $ | |||||||||||||||||
Noncontrolling interest is associated with the Garden segment.
F-38